Non-firm connection is a method of connecting without waiting for reinforcement, on the condition of output curtailment during congestion. In exchange for easier connection, output is reduced when the grid is congested. For developers, how much output curtailment to expect therefore determines a project’s economics.
To make this estimate easier, grid information and outlooks of output curtailment have been published. They are published by the government, the Organization for Cross-regional Coordination of Transmission Operators, JAPAN (OCCTO) and the general transmission and distribution companies (GT&D companies). This article explains the types of published information and the assumptions behind each and how to read them, following council materials from 2023 to 2026.
How non-firm connection works, the tiers of Japan’s grid and the key organizations are explained in the first article of this series.
Issues Identified in 2023
At the Grid Working Group (Grid WG) on May 29, 2023, the Agency for Natural Resources and Energy (ANRE) organized the issues. One of them was business predictability (how easily the future can be foreseen) for non-firm connection (Grid WG, 46th meeting, Material 4).
| Issue | Summary of the material | Page |
|---|---|---|
| Ensuring predictability | From the viewpoint of grid constraints as well, it is important to advance efforts to reduce output curtailment and ensure predictability | p.4 |
| Publication and disclosure of information | Advance the publication and disclosure of necessary grid information, including publication of output curtailment outlooks | p.8 |
| Burden on developers | Some say it is difficult to simulate the congestion outlook on their own from published information | p.16 |
| Information for batteries | Connecting grid-scale battery storage requires information not only on available capacity in the export flow direction (sending to the grid) but also on available capacity in the import flow direction (receiving from the grid) | p.15 |
Following this, “short-term outlooks” and “medium- to long-term outlooks” of output curtailment came to be published. The Grid WG’s discussions were taken over by its successor, the Next-Generation Power System Working Group, from January 23, 2025. They have continued up to the 13th meeting on October 6, 2026.
Types of Published Information
| Information | Published by | Coverage | Main use |
|---|---|---|---|
| Grid information (actual power flows, forecast power flows, available capacity, etc.) | Each GT&D company | Current grid | Check the condition of candidate systems for connection |
| Short-term outlook of grid-constrained curtailment | Each GT&D company | Around the next fiscal year | Learn which systems are likely to be congested in the near term |
| Medium- to long-term grid congestion outlook | OCCTO (every year) | Five fiscal years ahead | See future congestion and the amount of output curtailment |
| Status of congestion management and output curtailment | Each GT&D company | Actual results | Check curtailment that actually took place |
As an example of the status of output curtailment, TEPCO Power Grid publishes “Information on the Status of Output Curtailment due to Grid Congestion” (source field of Next-Generation Power System Working Group, 1st meeting, Material 4, p.3). Chubu Electric Power Grid reported to a government council that it issued curtailment instructions on 15 days between March 28 and April 28, 2025 (Next-Generation Power System Working Group, 3rd meeting, Material 2-3, p.8, June 27, 2025).
Reading Grid Information
GT&D companies have so far advanced the publication and disclosure of actual power flows (the flow of electricity) and forecast power flows (Grid WG, 46th meeting, Material 4, p.16). Forecast power flows show future flows taking into account the status of connection contract applications. ANRE states that this makes it possible to check the amount of congestion in light of the status of connection contract applications (Grid WG, 48th meeting, Material 4, p.8).
From Numerical Available Capacity to Forecast Power Flows
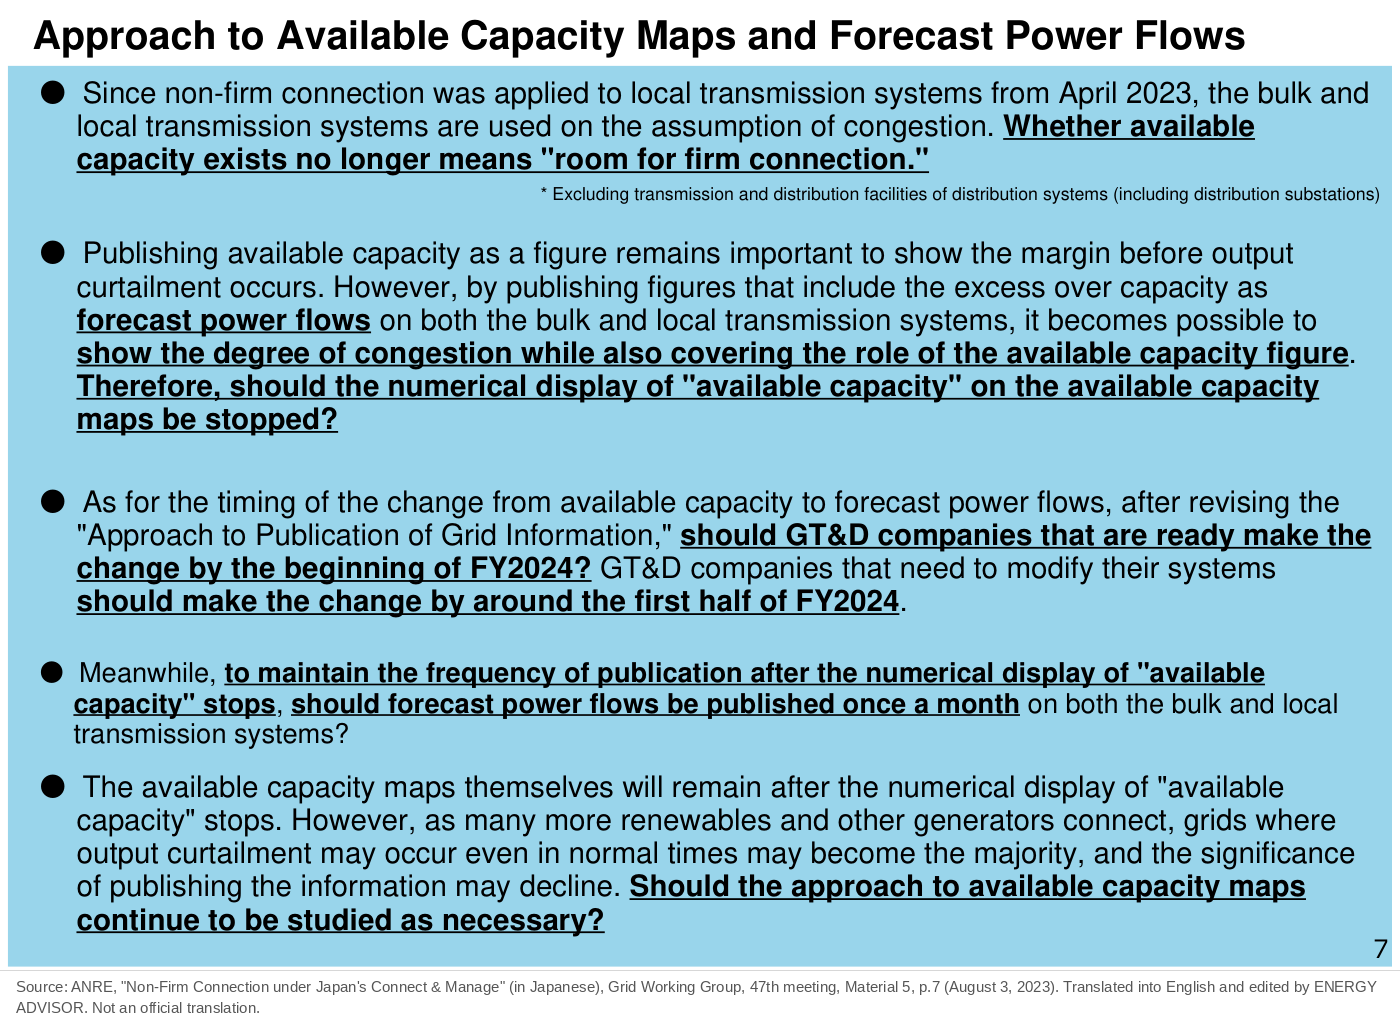
Previously, each company’s available capacity maps published numerical values of “available capacity (headroom)” for transmission lines and other facilities. At the 47th meeting of the Grid WG on August 3, 2023, a proposal to stop showing these numbers was presented (Grid WG, 47th meeting, Material 5, p.7).
| Item | Content |
|---|---|
| Reason | Grid use has become premised on congestion, so whether there is “available capacity” no longer means “room for a firm connection” |
| Replacement information | For both the bulk transmission system and local transmission systems, publish forecast power flows including amounts exceeding capacity. This shows the degree of congestion while also covering the role of the available capacity numbers |
| Timing | GT&D companies that are ready revise by the beginning of FY2024 (April 2024–March 2025). Companies that need system modifications aim to do so within the first half of FY2024 |
| Frequency of publication | Forecast power flows: once a month for both the bulk transmission system and local transmission systems |
For this reason, in today’s grid information, one looks at forecast power flows rather than numerical available capacity.
Available capacity is a value calculated under the “Guidelines for Rationalization of Assumed Power Flows.” Its assumptions differ from those of the medium- to long-term outlook explained later (Cross-Regional Network Development Committee, 103rd meeting, Material 3, p.23). Even for the same system, the available capacity figure and whether the medium- to long-term outlook shows congestion do not necessarily match.
Reading the Short-Term Outlook of Output Curtailment
Mechanism
The short-term outlook is published by GT&D companies for facilities where output curtailment due to grid congestion may occur in the next fiscal year. In May 2023, a draft of the items to be published was presented: annual output curtailment (kWh), maximum output curtailment (kW) and hours of output curtailment (Grid WG, 46th meeting, Material 4, p.23).
When output curtailment is expected, each GT&D company publishes the expected curtailment rate on its website or elsewhere. This is the curtailment rate relative to the scheduled value (Grid WG, 48th meeting, Material 4, p.10).
Assumptions (Example: Outlook for FY2024)
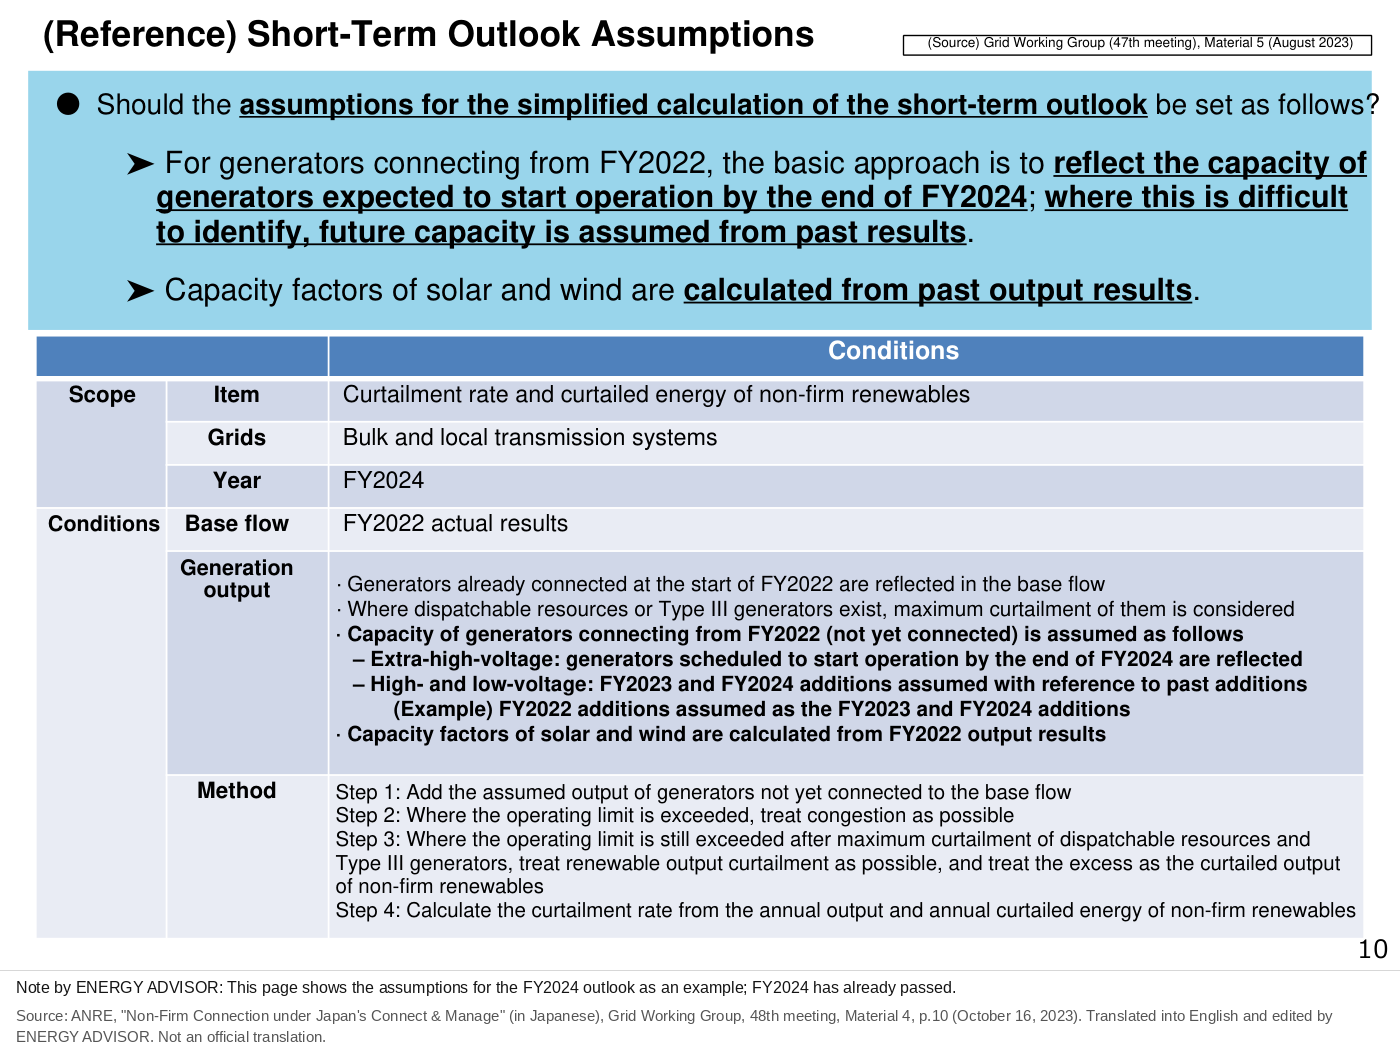
The assumptions of the FY2024 outlook, presented at the Grid WG on October 16, 2023, were as follows (Grid WG, 48th meeting, Material 4, p.11).
| Item | Assumption |
|---|---|
| Basis of power flows | Actual results for FY2022 |
| Generators already connected | Generators connected as of FY2022 are included in the actual flows |
| Generators not yet connected | Extra-high voltage: generators scheduled to start operation by the end of FY2024. High and low voltage: FY2022 installation volumes assumed to continue in FY2023 and FY2024 |
| Capacity factor of solar and wind | Calculated from actual output in FY2022 |
| How output curtailment is calculated | Add the output of generators not yet connected, and treat the amount exceeding the operating limit of the transmission line or transformer (unyo yoryo in Japanese) as congestion. The amount that still exceeds it after dispatchable resources and others are reduced as far as possible is the output curtailment of non-firm renewables |
This outlook expected output curtailment of solar and wind on two systems in TEPCO Power Grid’s service area (same, p.8). The material states that the location and timing of output curtailment may change depending on the installation of generators. It also notes that the outlook is not intended to evaluate supply reliability.
It is a simple method that adds later generator connections to actual flows. Therefore, if there are changes in generators or demand not included in the calculation assumptions, the results will change.
The publication status of short-term outlooks for FY2025 and later has not been confirmed. Next-Generation Power System Working Group, 8th meeting, Material 1 (March 16, 2026) deals with the outlook of output curtailment due to the supply-demand balance. It contained no short-term outlook of grid-constrained curtailment.
Reading the Medium- to Long-Term Grid Congestion Outlook
Mechanism
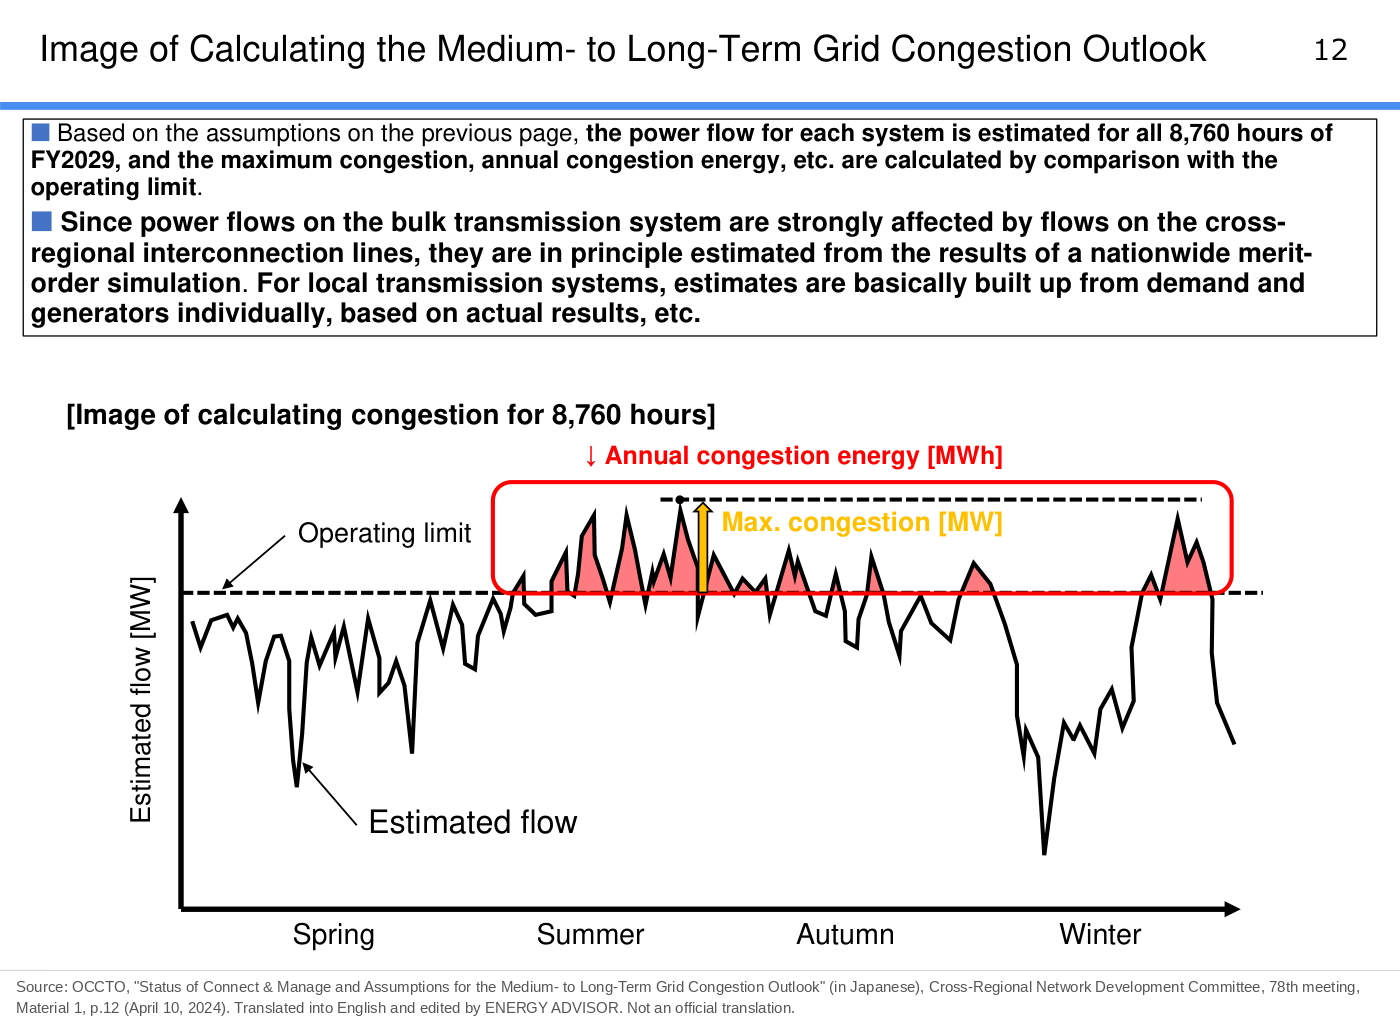
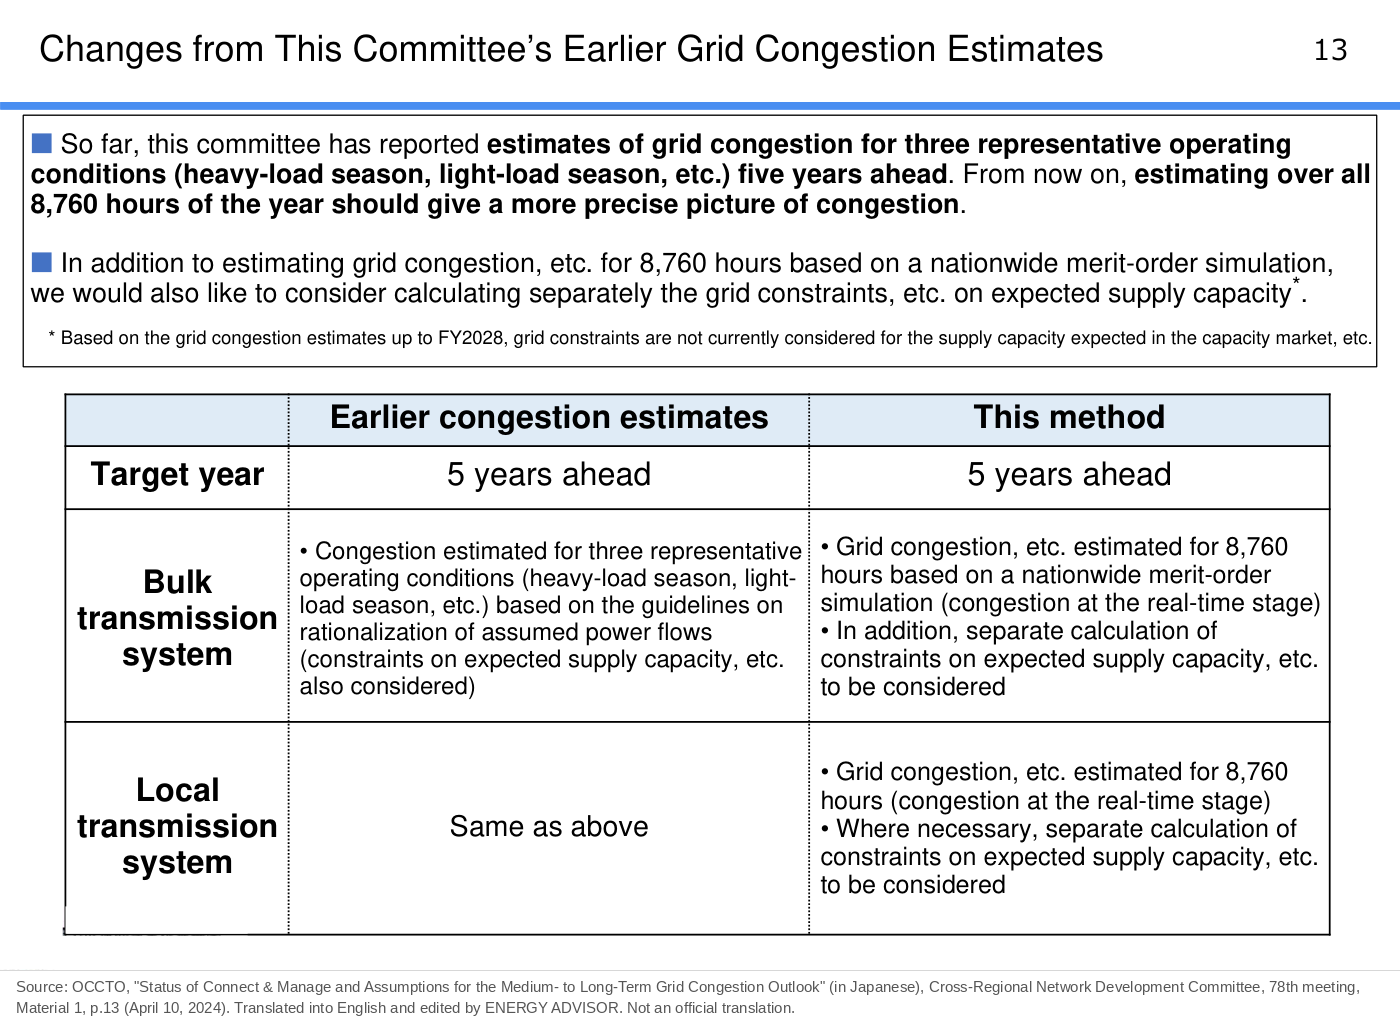
Since FY2024, OCCTO has calculated and published grid congestion five fiscal years ahead over all 8,760 hours of the year (Cross-Regional Network Development Committee, 78th meeting, Material 1, pp.11–13, April 10, 2024).
| Item | Content |
|---|---|
| Target systems | All bulk transmission systems and local transmission systems. Reinforcements entering service by the target year are taken into account |
| Target year | Five fiscal years ahead |
| Demand and generators | Based on the latest Electricity Supply Plan (ten-year plans that generation companies and others submit each year), demand and generators highly likely to start by the end of the target year are taken into account |
| Calculation method for the bulk transmission system | Flows are estimated by a nationwide merit-order simulation (running generators from the lowest operating cost). This is because the effect of flows on the cross-regional interconnection lines is large |
| Calculation method for local transmission systems | Demand and generators are built up individually, based on actual results and other data |
| Items calculated | Congested systems, congestion energy, output curtailment energy and so on, by area and by system |
Earlier outlooks estimated congestion only for three representative operating conditions, such as the heavy-load and light-load seasons. OCCTO states that extending this to all 8,760 hours of the year made it possible to understand congestion in more detail (same, p.13).
Trend in the Outlooks
| Target year | Published | Number of congested facilities | Main results |
|---|---|---|---|
| FY2029 | September 10, 2024 (83rd meeting) | About 60 facilities (as counted in the 92nd meeting summary. In the table in Grid WG, 52nd meeting, Material 2, p.11, facilities with solar and wind output curtailment number 39) | Grid-constrained output curtailment of solar and wind is large in the Hokkaido and Tohoku areas |
| FY2030 | September 2, 2025 (92nd meeting) | About 140 facilities | Annual output curtailment energy about 3–7 times the FY2029 estimate. Maximum output curtailment in the evening lighting hours (16:00–20:00) about 1.5 GW |
| FY2031 | September 1, 2026 (103rd meeting) | 177 facilities in the transition scenario, 180 in the current scenario | Annual output curtailment energy about 0.6 times the previous year in the transition scenario and about 2.4 times in the current scenario. Maximum output curtailment in the evening lighting hours about 2.5 GW (transition) and about 2.0 GW (current) |
The sources are Cross-Regional Network Development Committee, 92nd meeting, Material 2, p.49; 103rd meeting, Material 3, pp.24, 26 and 29; and Grid WG, 52nd meeting, Material 2, pp.5 and 11.
From the FY2030 edition, calculations are made under two scenarios. The difference is how the generation cost of thermal plants (fuel cost and CO2 countermeasure cost) is set (103rd meeting, Material 3, p.19).
| Scenario | How generation cost is set | Effect on results |
|---|---|---|
| Transition scenario | Generation cost for the target year calculated from the February 2025 report of the Power Generation Cost Verification Working Group | CO2 countermeasure costs rise, and coal becomes more expensive than LNG. The merit order by fuel type is reversed from today |
| Current scenario | The generation costs used in the FY2029 outlook | Close to today’s merit order |
The FY2031 edition is also calculated under the same two scenarios (same, p.19).
Key Points of the FY2031 Edition
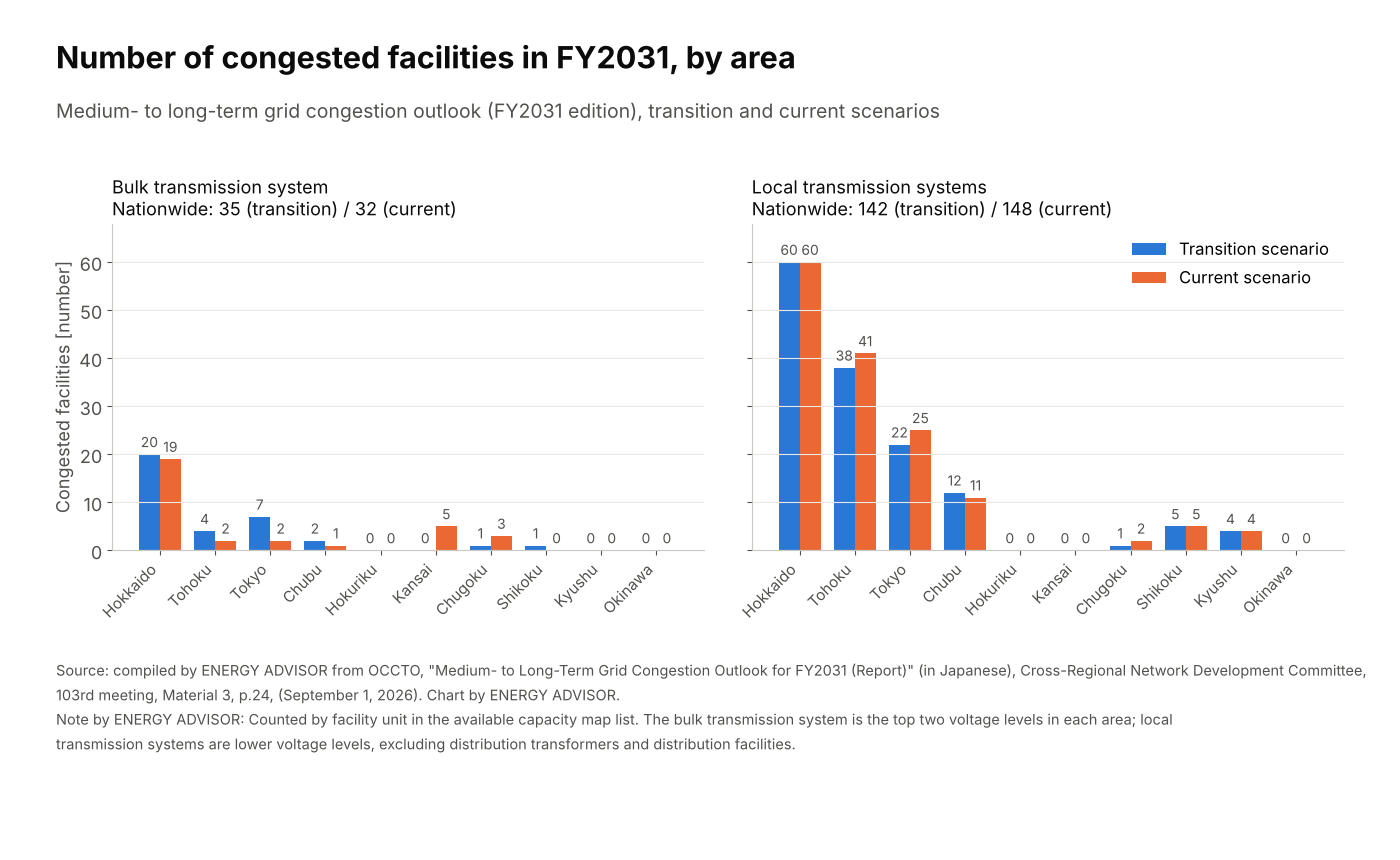
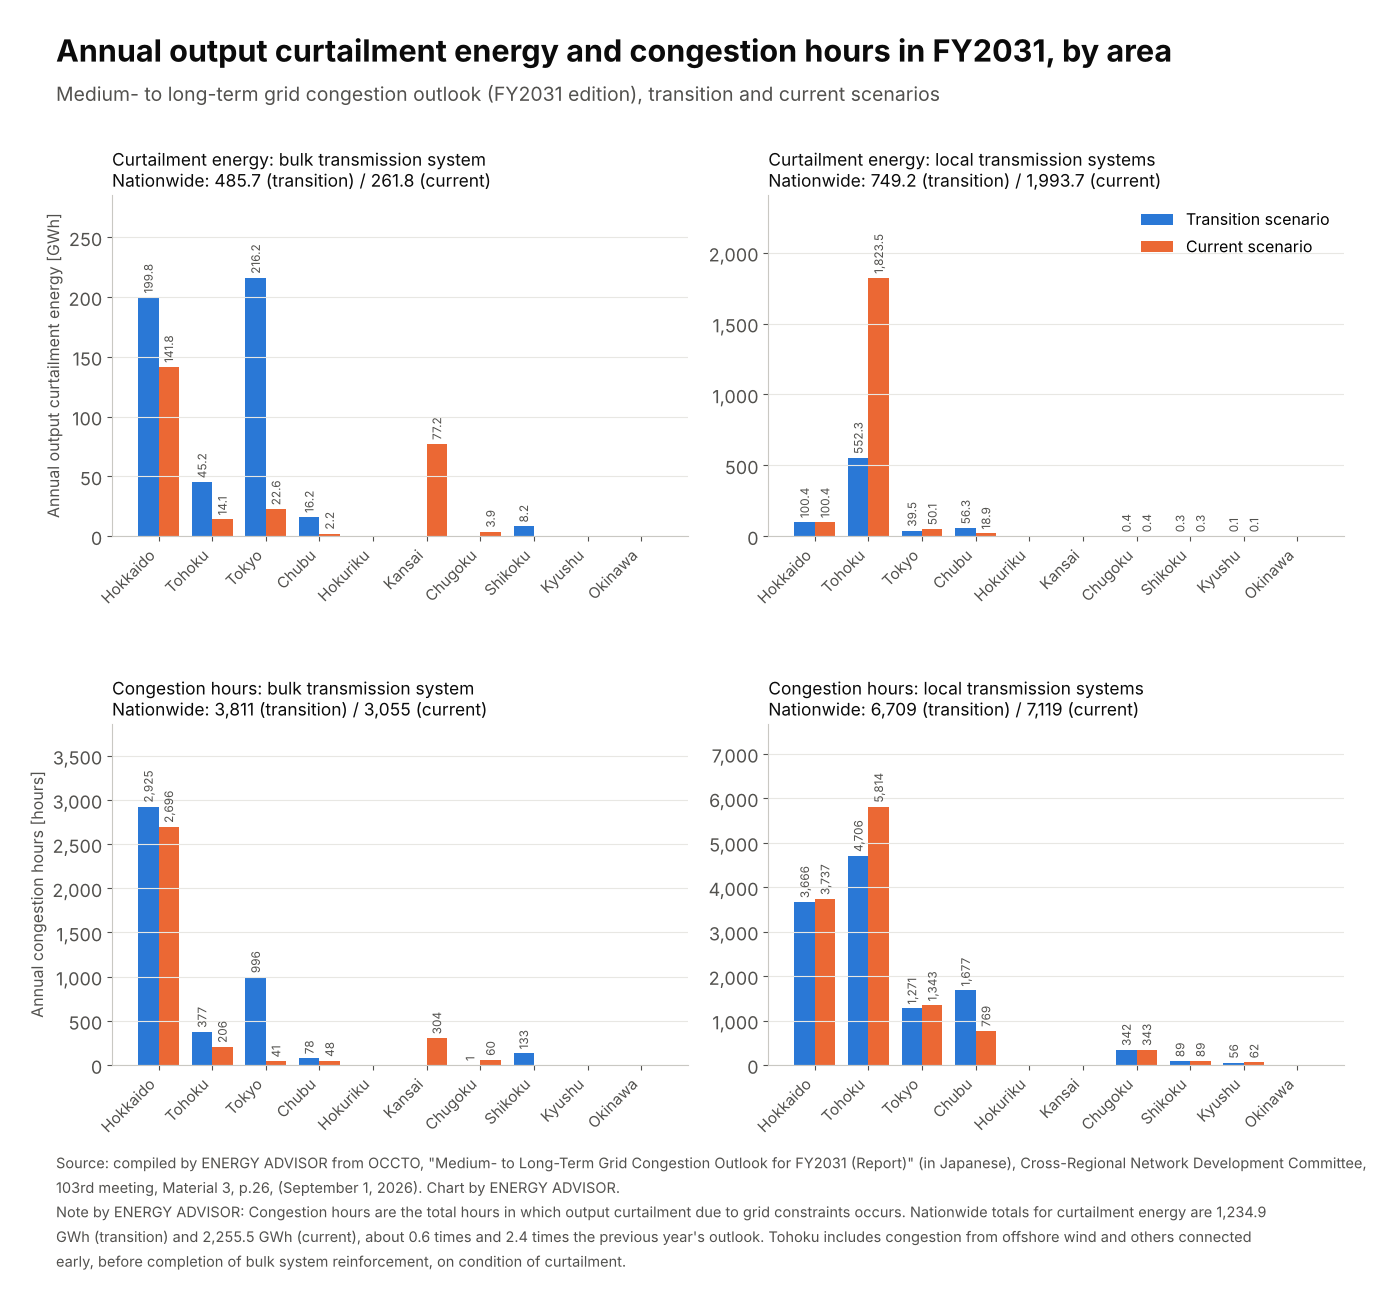
The main results of the FY2031 edition (103rd meeting, Material 3, September 1, 2026) are as follows.
| Item | Result | Page |
|---|---|---|
| Number of congested facilities | Nationwide, 177 facilities in the transition scenario and 180 in the current scenario. Up from about 140 in the previous year, with the increase mainly on local transmission systems | p.24 |
| Annual output curtailment energy | About 0.6 times the previous year in the transition scenario and about 2.4 times in the current scenario. Relative to national electricity demand in FY2031, about 0.14% and about 0.26% | p.26 |
| Maximum output curtailment in the evening lighting hours (16:00–20:00) | About 2.5 GW in the transition scenario and about 2.0 GW in the current scenario. Higher than the previous year | p.29 |
| Annual maximum output curtailment by area | In the eastern areas, depending on the scenario, expected to exceed 15% of FY2031 H3 demand (the average of the three highest daily peak demands; a guide to annual peak demand) | p.31 |
| Output curtailment of solar and wind | Rising mainly in the eastern areas. National output curtailment energy about 2.5 times the previous year | p.33 |
| Bulk transmission system in heavy-load seasons | Mainly in summer and winter daytime, several areas have facilities that are congested or have very little available capacity. It was confirmed that congestion can be relieved by redispatch | pp.38–40 |
In the transition scenario for the bulk transmission system, output curtailment in the Tokyo area fell as a result of revising the assumptions for large demand such as data centers (pp.14 and 26). This statement in the material applies only to the bulk transmission system. This calculation is based on the assumptions presented at the 9th meeting of the Next-Generation Power System Working Group on March 27, 2026 (pp.2 and 13).
Checking the Curtailment Rate of Your Own Generator
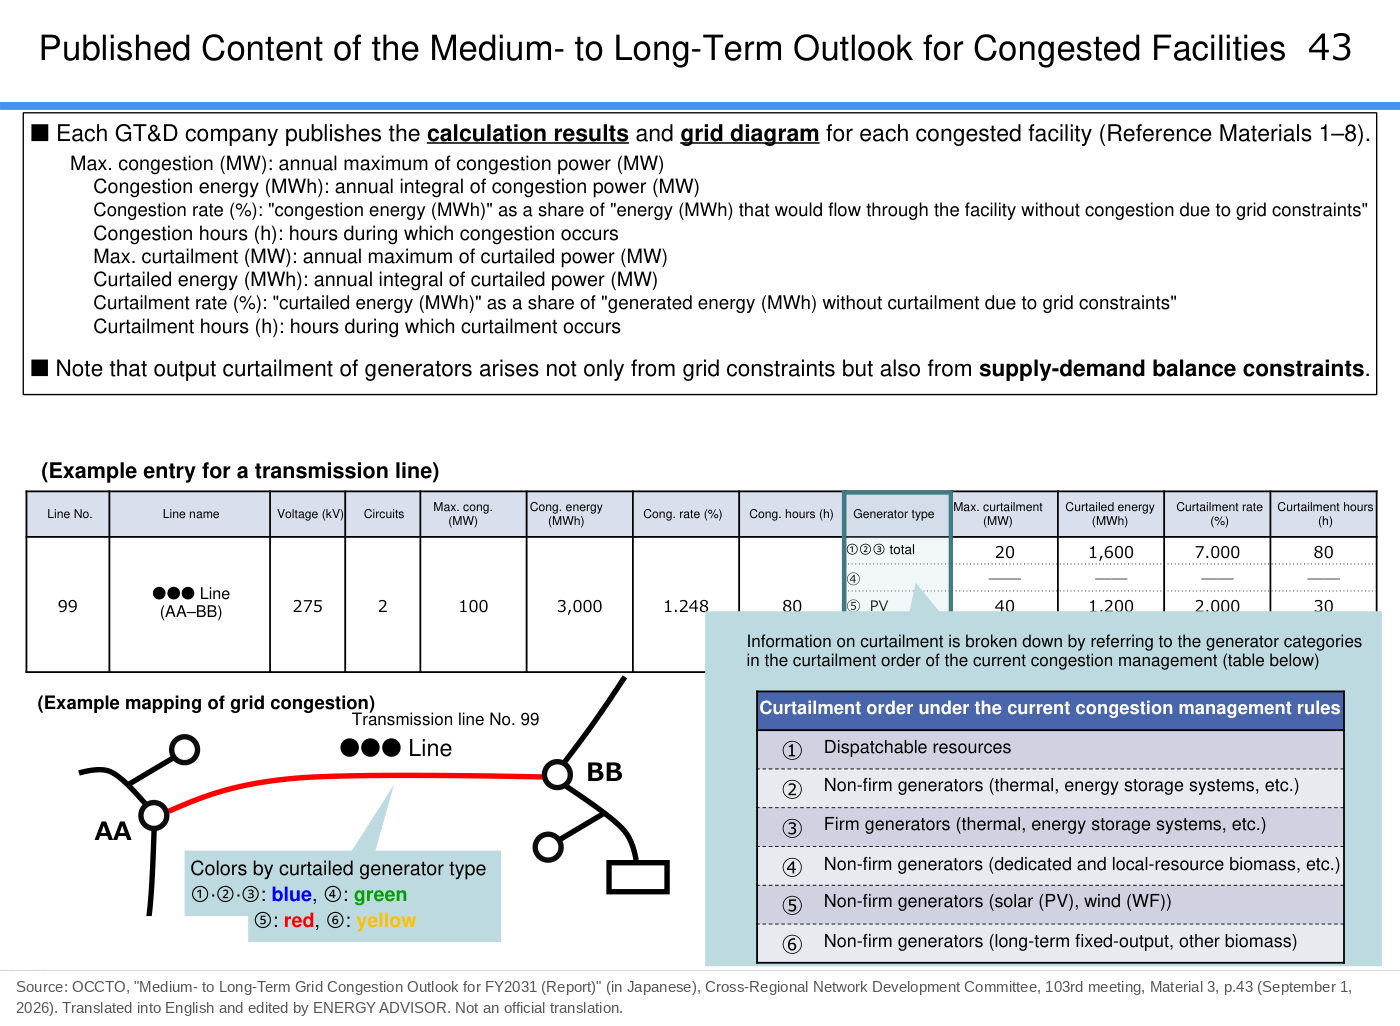
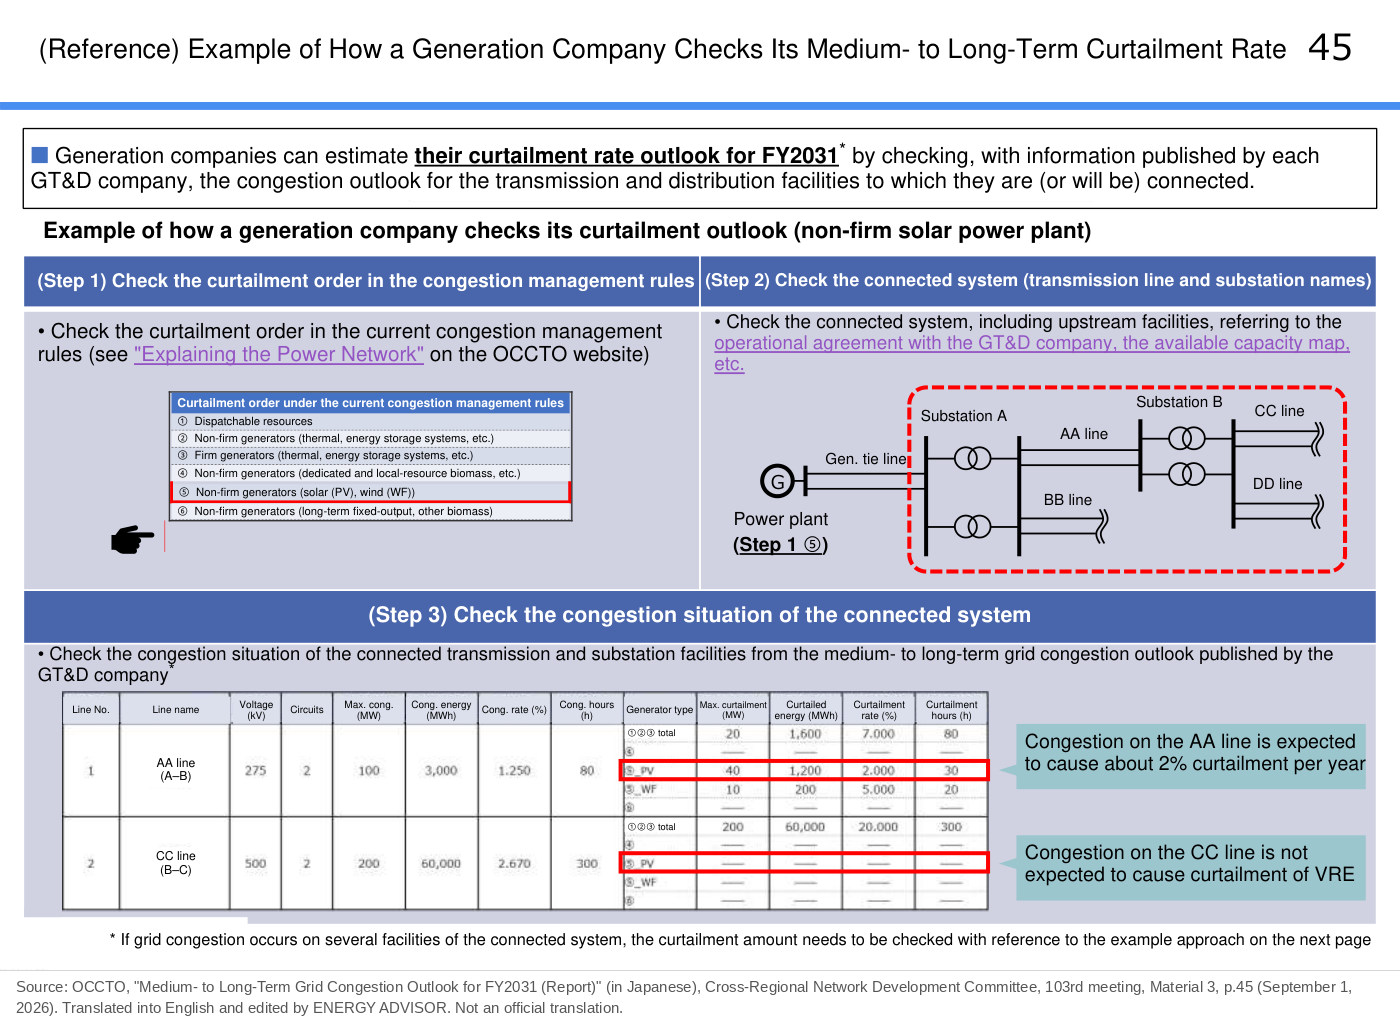
OCCTO shows a way for developers to check the outlook of output curtailment for their own generators (103rd meeting, Material 3, pp.45–47). The method is to compare the published information on congested facilities with the curtailment order under the current congestion management rules. The curtailment order is explained in the article on redispatch. Examples are also given of how to add up curtailment rates on loop and radial systems when several facilities are congested (p.46).
Results for each facility are published by each GT&D company. The main published items are as follows (92nd meeting, Material 2, p.43).
| Item | Meaning |
|---|---|
| Maximum congestion (MW) | Annual maximum of congestion power |
| Congestion energy (MWh) | Annual total of congestion power |
| Congestion rate (%) | Congestion energy as a share of the energy that would flow through the facility without congestion |
| Maximum output curtailment (MW) | Annual maximum of curtailed power |
| Curtailment rate (%) | Curtailed energy as a share of the energy that would have been generated without output curtailment |
| Hours of output curtailment (hours) | The hours during which output curtailment occurs |
Output curtailment information is shown separately for each generator category in the curtailment order. The categories include dispatchable resources, non-firm thermal and batteries, firm thermal and batteries, non-firm biomass, solar and wind. Developers need to check which category their own generator falls into before reading the results.
Note that output curtailment of generators occurs not only because of grid constraints but also because of supply-demand balance constraints, when electricity is in surplus across a whole area. The medium- to long-term outlook shows only curtailment due to grid constraints (92nd meeting, Material 2, p.43).
Limits of the Outlook and How to Use It
OCCTO gives the following cautions for the FY2031 edition (103rd meeting, Material 3, p.23).
- It is an estimate based on assumptions, not an “absolute outlook” for FY2031
- Results for the bulk transmission system do not take congestion management on local transmission systems into account. They therefore overestimate the flows coming up from lower systems and may be overstated
- The nationwide simulation does not take into account upward deviations in renewables or downward deviations in demand
- Available capacity and forecast power flows are based on the Guidelines for Rationalization of Assumed Power Flows and have different assumptions
It is also noted that if generators or demand not taken into account at the time of calculation increase or decrease, whether congestion occurs and how much may change (Grid WG, 52nd meeting, Material 2, p.31). In the FY2031 edition, the large change in output curtailment in the Tokyo area due to the revised assumptions for large demand is an example.
For this reason, the latest edition, updated every year, should be used. The basic approach is to look at the range across scenarios and then compare the results with the curtailment order category of your own generator.
A Coming Issue: The Move to Market-Based Congestion Management
In its summary of the FY2031 edition, OCCTO describes redispatch as “strictly an interim measure” (103rd meeting, Material 3, p.49). It considers it important to proceed with studies so as to move to market-based congestion management as quickly as possible.
The material also lists items to be studied in light of this outlook: the effect on supply reliability, the treatment of generators on congested systems in the capacity market, and how balancing capacity (ΔkW) should be secured in the Supply and Demand Balancing Market (balancing market). OCCTO states that it will study these in cooperation with government councils and others. No timing for the move is given.
Market-based methods and the status of studies on the co-optimization market (simultaneous market for energy and balancing capacity) are explained in the article on the co-optimization market, and the treatment in the balancing market in the article on grid-scale batteries and the balancing market.
Summary
Four types of information are published for estimating output curtailment under non-firm connection: GT&D companies’ grid information (forecast power flows), short-term outlooks of output curtailment, OCCTO’s medium- to long-term outlook, and the status of output curtailment.
The latest medium- to long-term outlook is the FY2031 edition (September 1, 2026). Congested facilities increased to about 180, and maximum output curtailment in the evening lighting hours was put at about 2.0–2.5 GW. Because the outlook is not absolute, developers need to use the latest edition each year and read it against the curtailment order category of their own generator.
This article is based on published materials from the Ministry of Economy, Trade and Industry and its Agency for Natural Resources and Energy, the Electricity and Gas Market Surveillance Commission, the Organization for Cross-regional Coordination of Transmission Operators (OCCTO) and other sources. The English translations of figures are by ENERGY ADVISOR and are not official translations. When using this information for decisions, please check the original sources. When we find an error, we correct the article and note the date of the correction.
Sources
- ANRE, “Non-Firm Connection Initiatives under the Japanese Version of Connect & Manage” (in Japanese), Grid Working Group, 46th meeting, Material 4 (May 29, 2023), pp.4, 8, 15, 16 and 23. https://www.meti.go.jp/shingikai/enecho/shoene_shinene/shin_energy/keito_wg/pdf/046_04_00.pdf
- ANRE, “Non-Firm Connection Initiatives under the Japanese Version of Connect & Manage” (in Japanese), Grid Working Group, 47th meeting, Material 5 (August 3, 2023), p.7. https://www.meti.go.jp/shingikai/enecho/shoene_shinene/shin_energy/keito_wg/pdf/047_05_00.pdf
- ANRE, “Non-Firm Connection Initiatives under the Japanese Version of Connect & Manage” (in Japanese), Grid Working Group, 48th meeting, Material 4 (October 16, 2023), pp.8, 10 and 11. https://www.meti.go.jp/shingikai/enecho/shoene_shinene/shin_energy/keito_wg/pdf/048_04_00.pdf
- ANRE, “Non-Firm Connection Initiatives under the Japanese Version of Connect & Manage” (in Japanese), Grid Working Group, 52nd meeting, Material 2 (September 18, 2024), pp.5, 11 and 31. https://www.meti.go.jp/shingikai/enecho/shoene_shinene/shin_energy/keito_wg/pdf/052_02_00.pdf
- OCCTO, “Status of Connect & Manage and Assumptions for the Medium- to Long-Term Grid Congestion Outlook” (in Japanese), Cross-Regional Network Development Committee, 78th meeting, Material 1 (April 10, 2024), pp.11–13. https://www.occto.or.jp/iinkai/kouikikeitouseibi/2024/files/seibi_78_01_01.pdf
- OCCTO, Cross-Regional Network Development Committee, 83rd meeting, Material 3 (in Japanese) (September 10, 2024). https://www.occto.or.jp/iinkai/kouikikeitouseibi/2024/files/seibi_83_03_01.pdf
- OCCTO, “Medium- to Long-Term Grid Congestion Outlook for FY2030 (Report)” (in Japanese), Cross-Regional Network Development Committee, 92nd meeting, Material 2 (September 2, 2025), pp.43, 49 and 53. https://www.occto.or.jp/iinkai/kouikikeitouseibi/2025/files/seibi_92_02_01.pdf
- OCCTO, “Medium- to Long-Term Grid Congestion Outlook for FY2031 (Report)” (in Japanese), Cross-Regional Network Development Committee, 103rd meeting, Material 3 (September 1, 2026), pp.2, 13, 14, 19, 23–24, 26, 29, 31, 33, 38–40, 45–47 and 49. https://www.occto.or.jp/assets/iinkai/kouikikeitouseibi/103/seibi_103_03_01.pdf
- ANRE, “Non-Firm Connection Initiatives under the Japanese Version of Connect & Manage” (in Japanese), Next-Generation Power System Working Group, 1st meeting, Material 4 (January 23, 2025), p.3. https://www.meti.go.jp/shingikai/enecho/denryoku_gas/saisei_kano/smart_power_grid_wg/pdf/001_04_00.pdf
- Chubu Electric Power Grid, “Status of Renewable Energy Output Curtailment due to Grid Congestion” (in Japanese), Next-Generation Power System Working Group, 3rd meeting, Material 2-3 (June 27, 2025), p.8. https://www.meti.go.jp/shingikai/enecho/denryoku_gas/saisei_kano/smart_power_grid_wg/pdf/003_02_03.pdf
- ANRE, “Long-Term Outlook of Renewable Energy Output Curtailment, etc.” (in Japanese), Next-Generation Power System Working Group, 8th meeting, Material 1 (March 16, 2026). https://www.meti.go.jp/shingikai/enecho/denryoku_gas/saisei_kano/smart_power_grid_wg/pdf/008_01_00.pdf
- METI, Next-Generation Power System Working Group (meetings) (in Japanese). https://www.meti.go.jp/shingikai/enecho/denryoku_gas/saisei_kano/smart_power_grid_wg/index.html