The Main Auction of the capacity market is the main auction, held four years before the delivery year. This article explains which resources can take part, how the demand curve is built and how the clearing price is determined, and organizes the results of the six auctions so far using the correct indicators. The basics of Japan’s electricity system are explained in the first article of this series, and the annual cycle in the second.
Participants and Eligible Resources
Eligible companies
The auction is open to “power generation companies” that can provide supply capacity during the delivery period and to “aggregators” that bundle demand response (DR, a mechanism in which customers reduce their electricity use as a substitute for supply capacity) and other resources.
Resource categories
Eligible resources are divided into the following four categories (glossary in Capacity Market Main Auction Clearing Results (Delivery Year FY2029), PDF p.6).
| Category | Description | Examples |
|---|---|---|
| Stable resources | Resources that provide stable supply capacity with expected capacity of 1,000 kW or more | Thermal, nuclear, hydropower (regulating and reservoir types), pumped storage (able to generate for 3 hours or more), battery storage (able to discharge for 3 hours or more), geothermal, biomass, waste |
| Variable resources (single) | Naturally variable resources with expected capacity of 1,000 kW or more | Hydropower (that cannot provide supply capacity steadily), wind, solar |
| Variable resources (aggregated) | Combinations of naturally variable resources under 1,000 kW that reach expected capacity of 1,000 kW or more | Same as above |
| Dispatch-on-command resources | DR, resources of 1,000 kW or more that cannot provide supply capacity steadily, and combinations of resources under 1,000 kW, reaching expected capacity of 1,000 kW or more | DR, on-site generation, bundles of small battery storage |
Expected capacity is the maximum capacity, out of the installed capacity, that can be expected as supply capacity in the service area in the delivery year. It is calculated by subtracting from the installed capacity the electricity used within the plant, output reductions due to temperature, and so on.
A new entrant retailer that does not own thermal power plants could take part with renewable energy (variable resources), DR (dispatch-on-command resources) and so on.
Ineligible resources
- Resources under the Feed-in Tariff (FIT) scheme cannot take part. Resources whose purchase period ends before the start of the delivery year can take part. Biomass co-firing (other than co-firing with coal) can take part for the portion not covered by FIT.
- Resources under the Feed-in Premium (FIP) scheme (which pays a premium on top of the market price) whose support period overlaps with the delivery year are treated the same as FIT resources.
- Resources used exclusively for self-consumption cannot take part. If a resource has generating capacity above what self-consumption needs and can provide supply capacity, it can take part.
- Resources used exclusively for self-wheeling or specified supply cannot, in principle, take part. Self-wheeling means sending electricity over the grid to another site of the same company. Specified supply means supplying electricity directly to specific customers under a permit under the Electricity Business Act.
Among renewables, FIT and FIP resources basically cannot take part, but post-FIT resources whose purchase period has ended can.
Bidding units and participation registration
The bidding unit is set for each resource category. Stable resources and variable resources (single) bid by metering unit. A metering unit is a receiving or supply point fitted with a meter of the general transmission and distribution company (GT&D company). Variable resources (aggregated) bid by small variable resource list, and dispatch-on-command resources by resource list.
Participants register before the auction. They register “company information,” “resource information” and “expected capacity” in that order. If there are no deficiencies, they receive notice of eligibility and bid by registering a bid volume (kW) and a bid price (¥/kW) for each metering unit or list.
Demand Curve (Target Procurement Volume and Net CONE)
How the demand curve is built
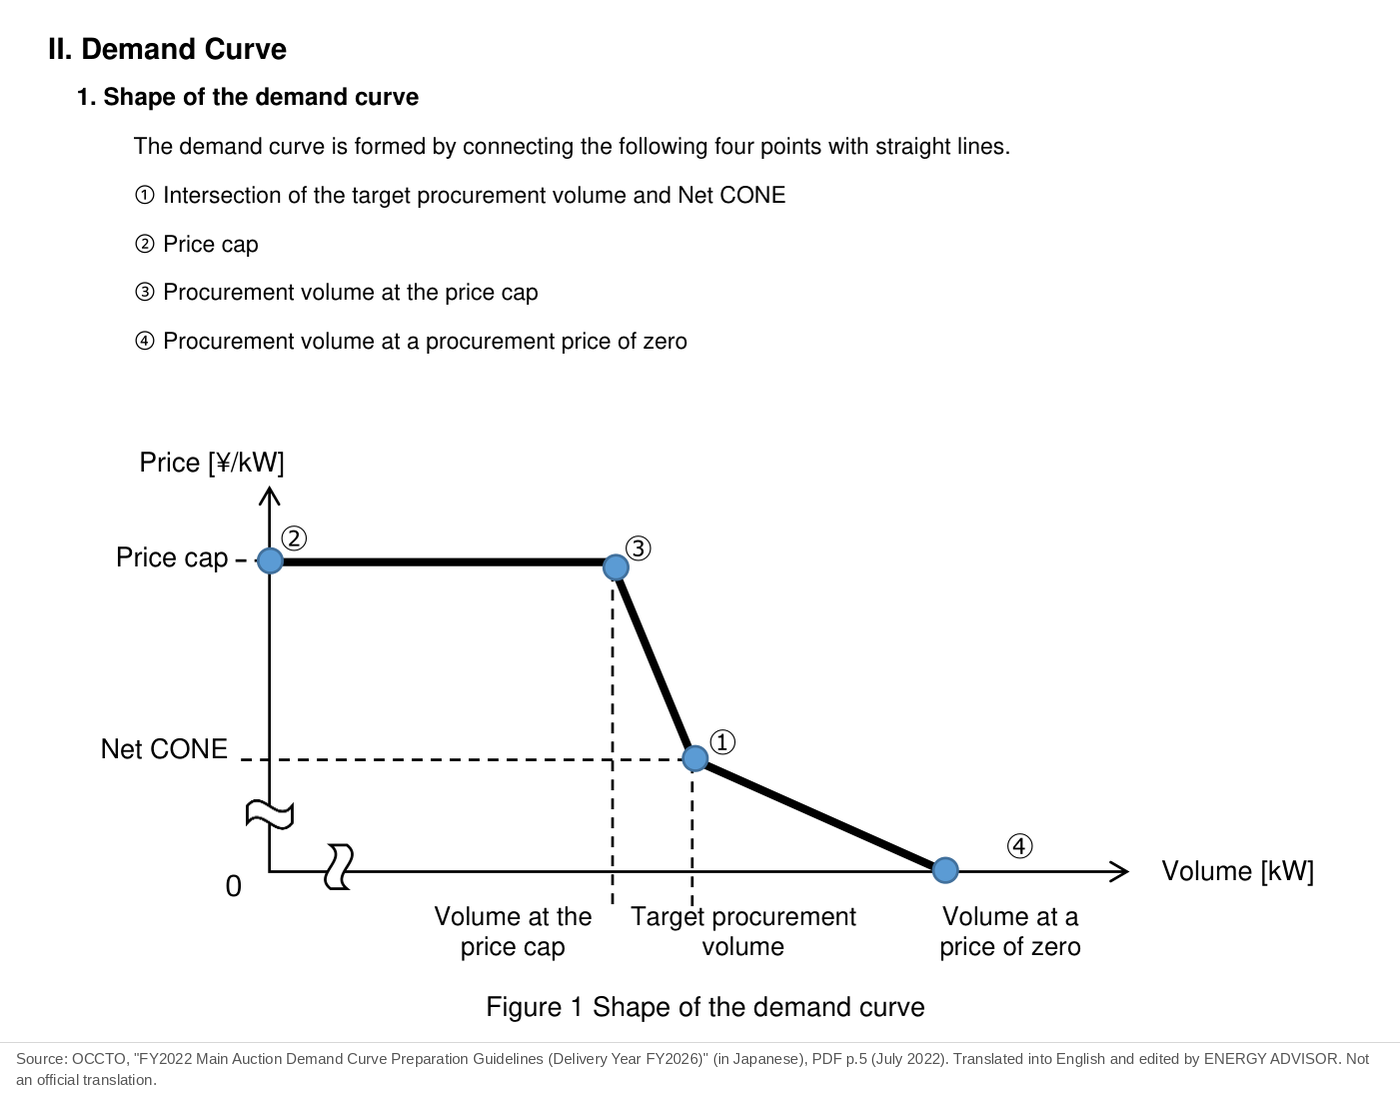
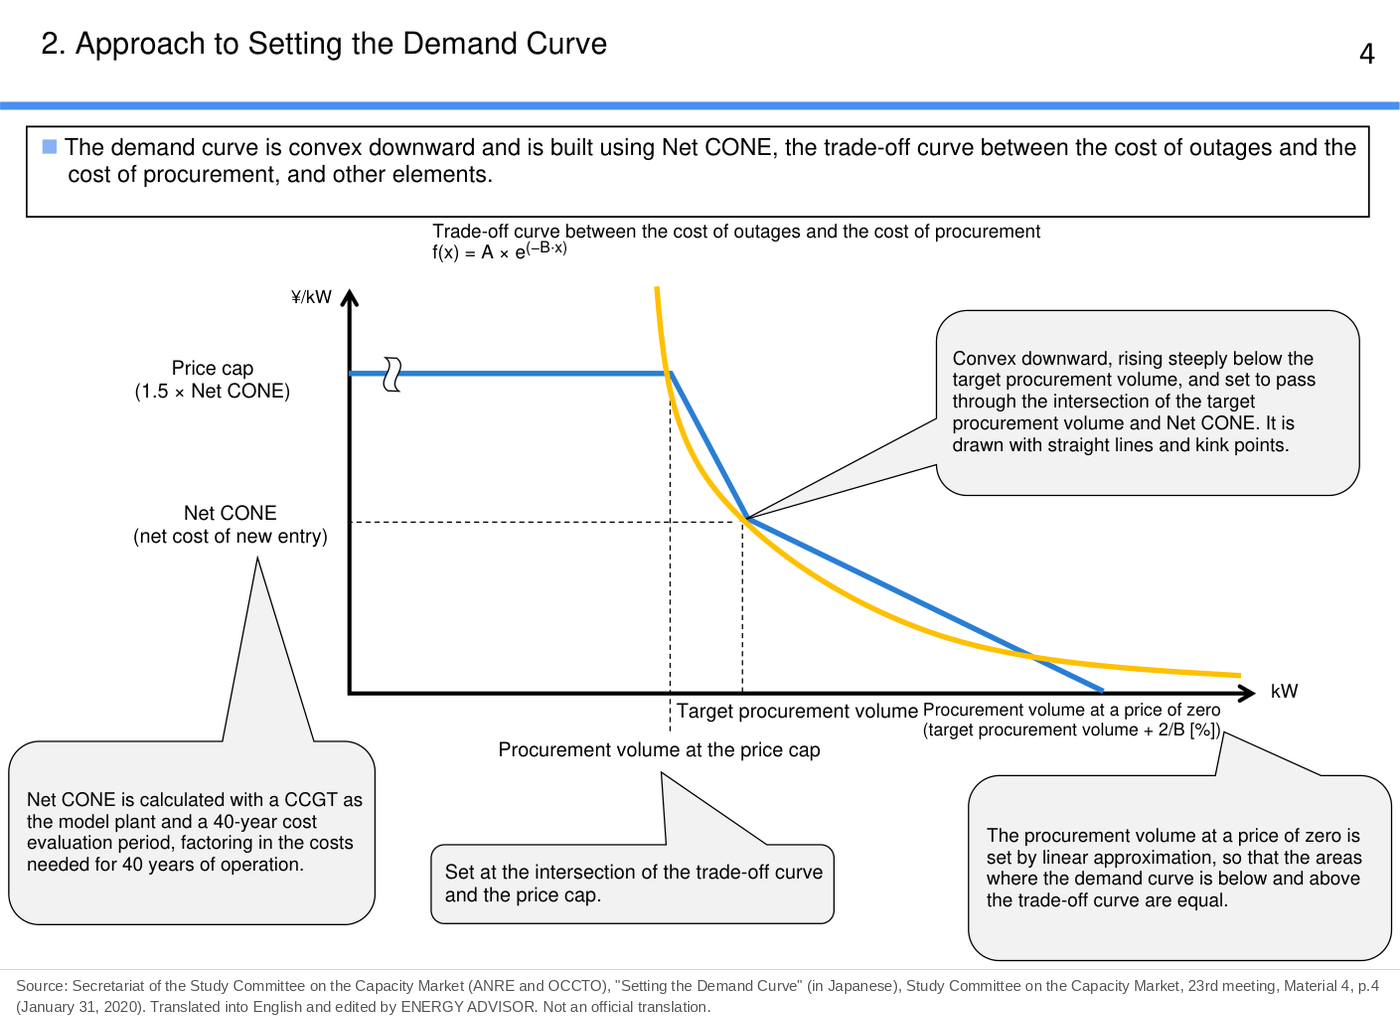
The demand curve of the Main Auction (OCCTO’s buy-bid curve) is prepared by OCCTO. The method is set out and published as the “Demand Curve Preparation Guidelines.”
- Point 1 is the intersection of the “target procurement volume” and the “indicative price (Net CONE).”
- The price cap at Point 2 is set at 1.5 times Net CONE.
- An “approximate curve connecting the points where the sum of the cost of outages and the cost of procurement is minimized” (the trade-off curve) is drawn through Point 1.
- The trade-off curve is approximated by a straight line; its intersection with the price cap is Point 3, and its intersection with the horizontal axis (procurement price of zero) is Point 4.
- Connecting Points 1 to 4 gives the demand curve.
Target procurement volume
The target procurement volume is set in light of the supply capacity needed nationwide. It is the sum of the following elements.
- Supply capacity for annual peak demand (H3 demand). H3 demand is the average of the three highest daily peak demands (hourly averages) in a month
- Supply capacity for demand fluctuations due to economic cycles and similar factors (persistent demand fluctuation)
- Supply capacity for unplanned outages of resources, changes in the output of variable resources, and demand fluctuations due to temperature and similar factors (contingent supply-demand fluctuation)
- Supply capacity for rare but severe contingencies and extreme weather
- Additional capacity reflecting planned outages
Indicative price (Net CONE)
Net CONE is a price based on the cost of building and maintaining a new power plant. It is calculated by levelizing the total cost over the evaluation period and subtracting revenue from sources other than the capacity market. CONE stands for Cost of New Entry. The model plant is an LNG-fired plant that combines gas and steam turbines (CCGT) (Study Committee on the Capacity Market, 74th meeting, Material 4, PDF p.10).
Clearing, Market Splitting and Multi-Price Pricing
Clearing process
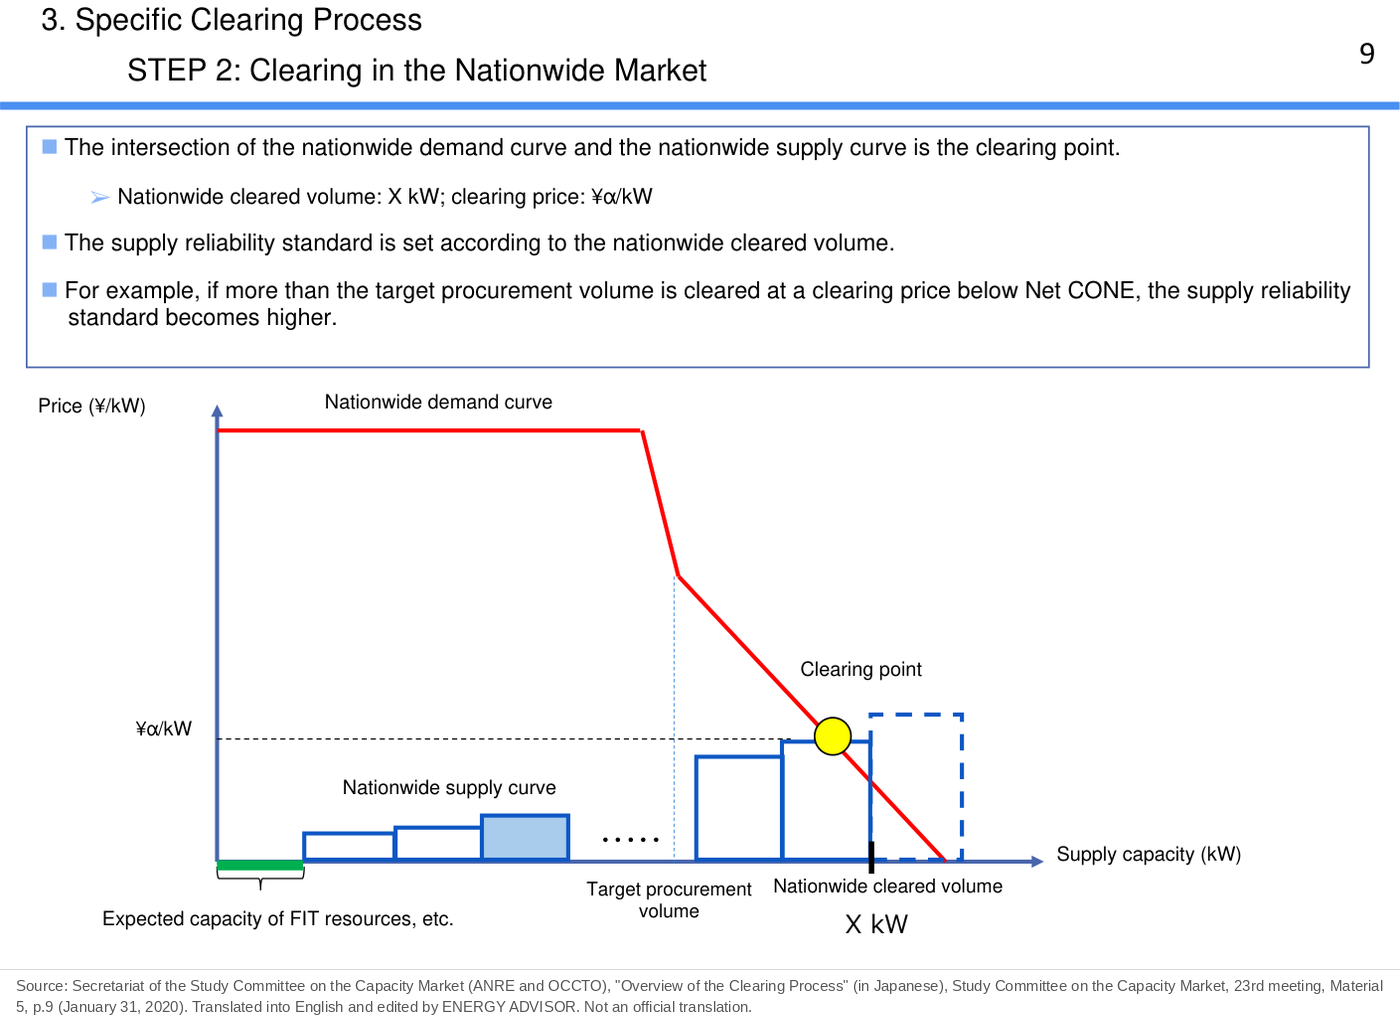
The supply curve is built by ranking resources from the lowest bid price. FIT resources and others do not take part in the capacity market but are included in the stacking of the supply curve. The intersection of the nationwide demand curve and the nationwide supply curve is the clearing point.
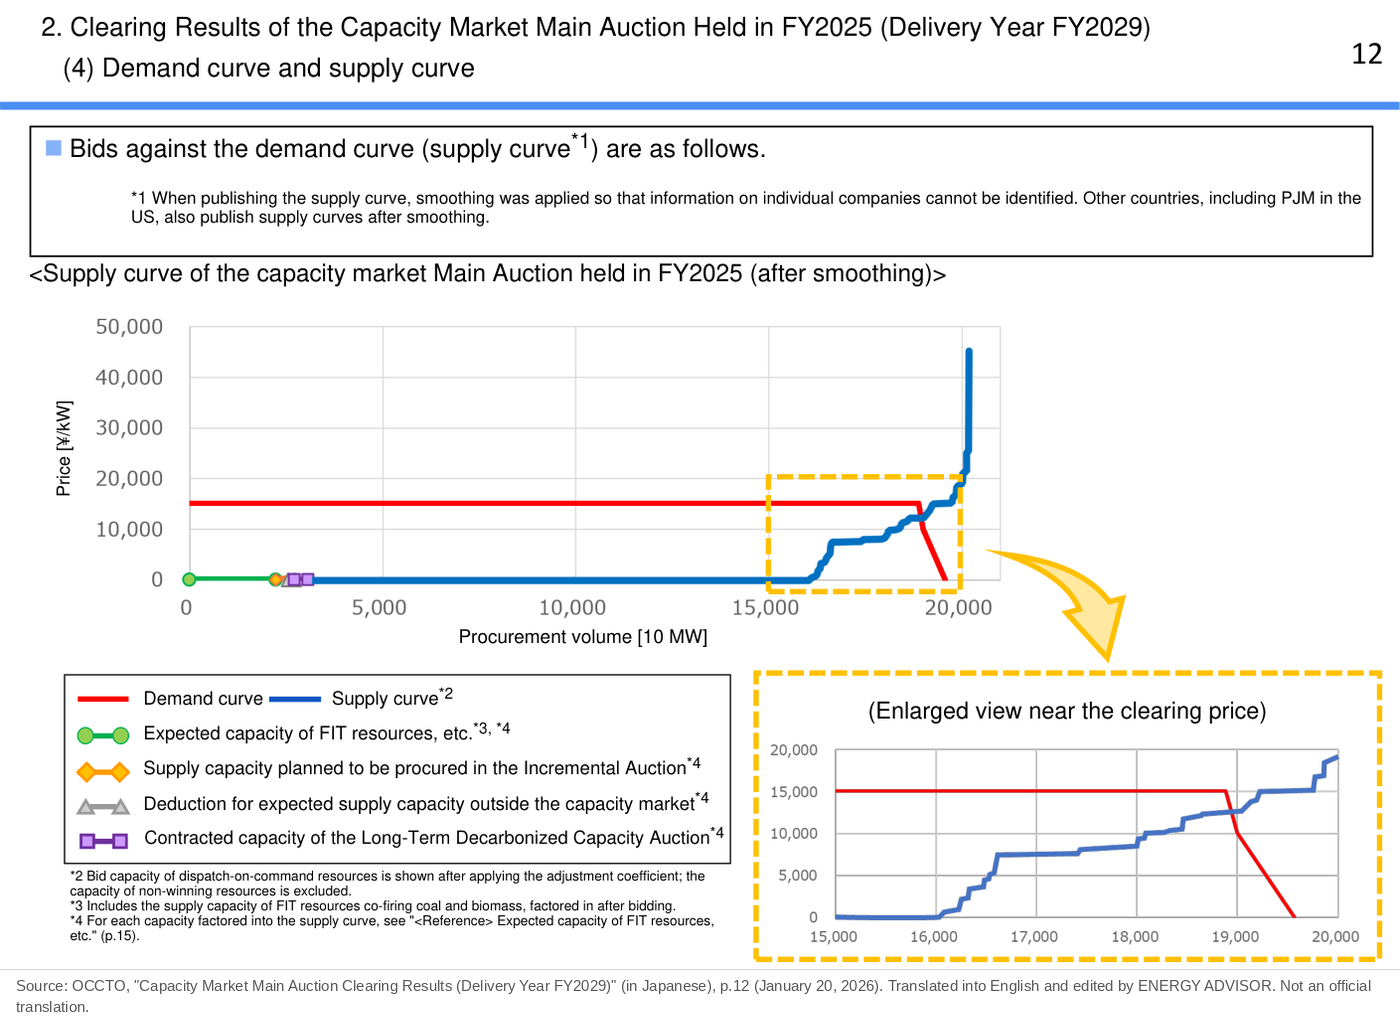
Most bids are at ¥0. For delivery year FY2029 (April 2029–March 2030), 74.7% of the bid volume was bid at ¥0 (clearing results for FY2029, PDF p.34).
Market splitting
Supply reliability is an indicator of the reliability of electricity supply. It is expressed as the expected annual unserved energy (kWh) per 1 kW of demand (clearing results for FY2029, PDF p.7).
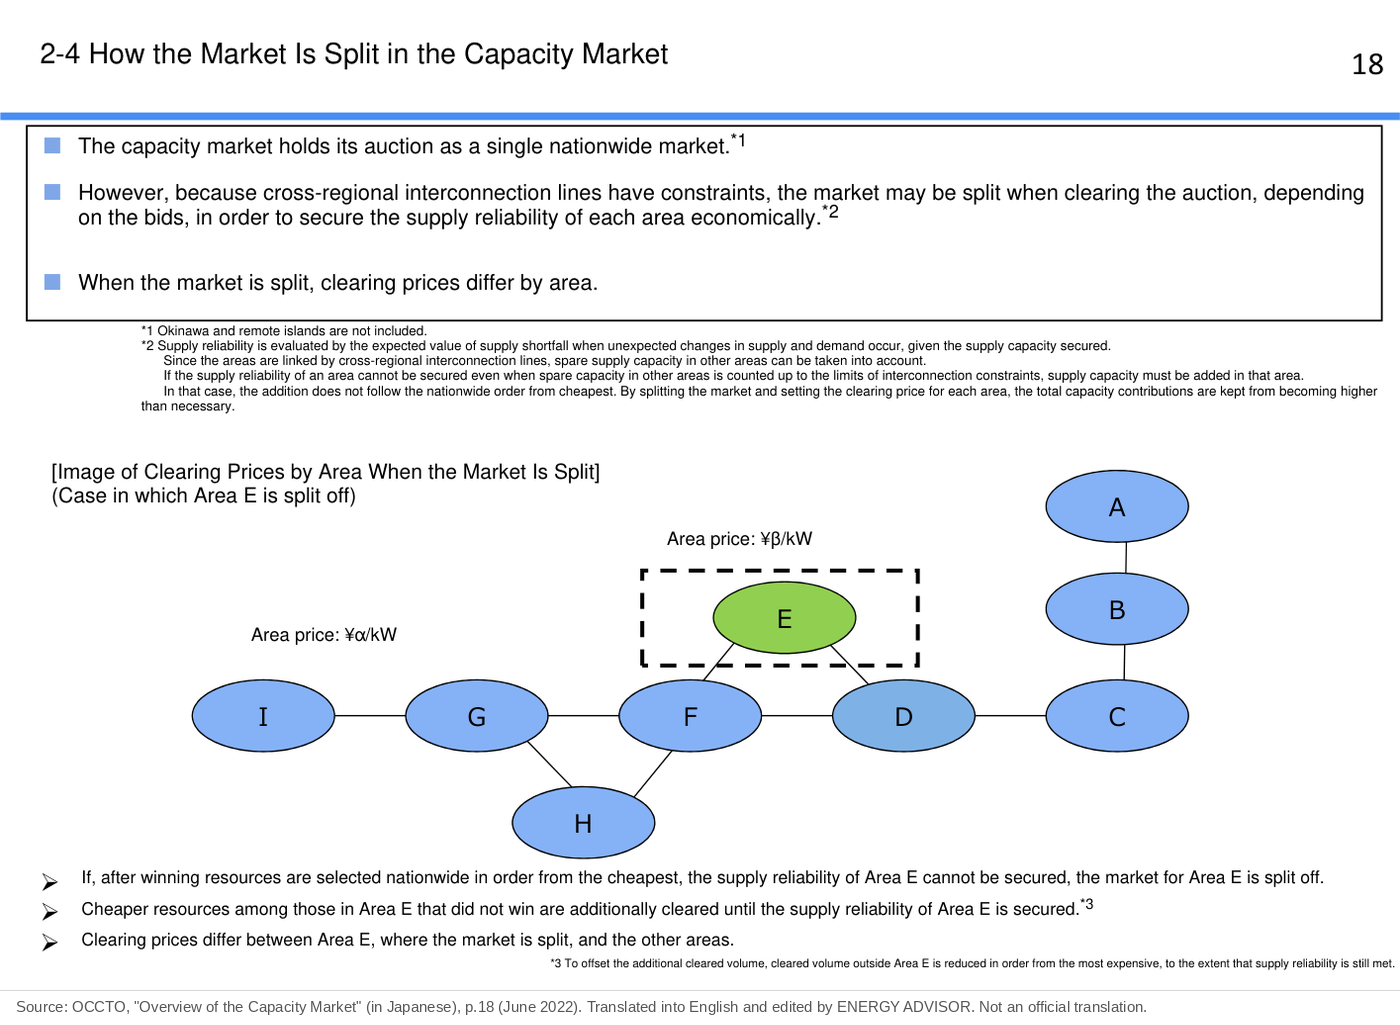
The capacity market is cleared as a single nationwide market, and resources win from the lowest price. As a result, some areas have many winning resources and others have few.
In areas with few winning resources, the supply reliability standard may not be met. OCCTO assesses whether supply capacity is still short even after adding spare capacity from other areas over cross-regional interconnection lines.
If supply reliability cannot be secured even when interconnection constraints are taken to their limit, the market is split, and additional resources in that area are cleared. In areas with sufficient supply capacity, on the other hand, awards are reduced starting from the resources with the highest bid prices, within the range that keeps nationwide supply reliability.
When the market is split, the clearing price differs by area. In an area where resources were added, the bid price of the last resource added becomes that area’s clearing price (the area price).
Multi-price pricing
The Main Auctions for delivery years FY2026–FY2029 had a mechanism for areas where competition might be limited. It dealt with cases in which an area’s price would exceed 1.5 times the price of the neighboring area. In that case, 1.5 times the neighboring area’s price became that area’s area price. Resources that bid above that price cleared at their own bid prices (clearing results for FY2029, PDF p.8).
Multi-price pricing was actually applied in Hokkaido and Kyushu for delivery year FY2026, and in Kyushu for FY2027 and FY2028. The special notes in the clearing results for FY2029 do not mention multi-price pricing being applied. For delivery year FY2030, this mechanism has been removed (last section of this article).
Results of the Six Auctions
Area prices
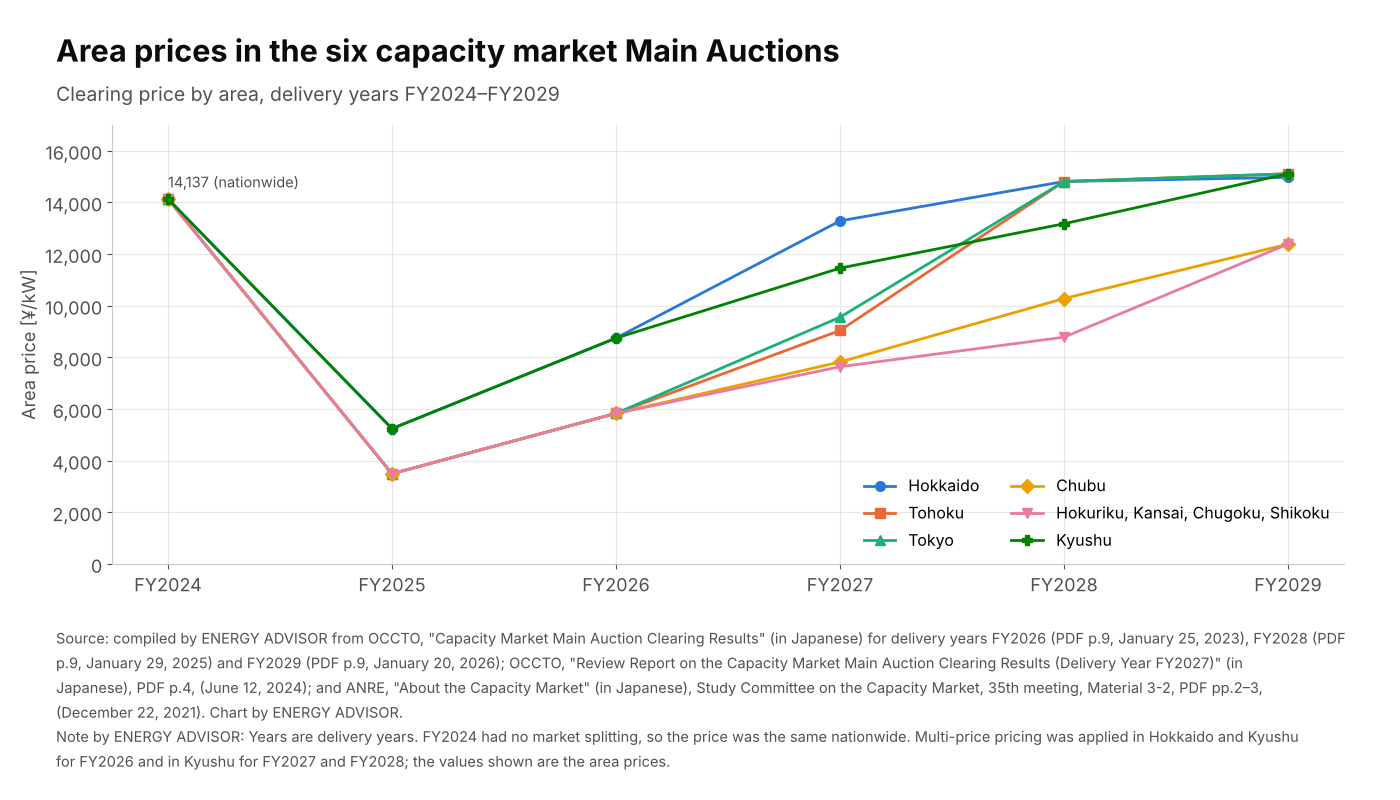
The clearing price for each area (the area price) is as follows.
| Area | FY2024 | FY2025 | FY2026 | FY2027 | FY2028 | FY2029 |
|---|---|---|---|---|---|---|
| Hokkaido | 14,137 | 5,242 | 8,749 | 13,287 | 14,812 | 14,972 |
| Tohoku | 14,137 | 3,495 | 5,833 | 9,044 | 14,812 | 15,111 |
| Tokyo | 14,137 | 3,495 | 5,834 | 9,555 | 14,812 | 15,111 |
| Chubu | 14,137 | 3,495 | 5,832 | 7,823 | 10,280 | 12,388 |
| Hokuriku, Kansai, Chugoku and Shikoku | 14,137 | 3,495 | 5,832 | 7,638 | 8,785 | 12,388 |
| Kyushu | 14,137 | 5,242 | 8,748 | 11,457 | 13,177 | 15,112 |
(Unit: ¥/kW. Years are delivery years. For FY2024 there was no market splitting, so the price was uniform nationwide.)
Total cleared capacity and total clearing amount
| Delivery year (year held) | Bidding period | Results published | Total cleared capacity | Total clearing amount (after transitional measures) | Average price (total amount ÷ total capacity) |
|---|---|---|---|---|---|
| FY2024 (FY2020) | July 1–7, 2020 | September 14, 2020 | 167.69 GW | ¥1,598.7 billion | ¥9,533/kW |
| FY2025 (FY2021) | October 1–14, 2021 | December 22, 2021 | 165.34 GW | ¥514.0 billion | ¥3,109/kW |
| FY2026 (FY2022) | November 1–16, 2022 | January 25, 2023 | 162.71 GW | ¥842.5 billion | ¥5,178/kW (calculated) |
| FY2027 (FY2023) | October 13–25, 2023 | January 24, 2024 | 167.45 GW | ¥1,314.0 billion | ¥7,847/kW (calculated) |
| FY2028 (FY2024) | October 15–25, 2024 | January 29, 2025 | 166.21 GW | ¥1,850.6 billion | ¥11,134/kW (calculated) |
| FY2029 (FY2025) | October 14–24, 2025 | January 20, 2026 | 166.08 GW | ¥2,209.4 billion | ¥13,303/kW (calculated) |
(The total cleared capacity and total clearing amount for FY2027 are the values in the clearing results (January 24, 2024), PDF p.9, and are the same as in the review report (June 2024). The publication date of the results for FY2025 is from the cover of the clearing results (Delivery Year FY2025) (December 22, 2021). The average prices for FY2024 and FY2025 are ANRE’s figures (“overall average price” and “overall average unit price”). The average prices from FY2026 onward are calculated from the total cleared capacity and total clearing amount. The bidding period for FY2026 is from the clearing results for FY2026, PDF p.5, and that for FY2028 from the clearing results for FY2028, PDF p.5.)
The “average price” in the table for FY2024 and FY2025 is the figure published by the Agency for Natural Resources and Energy (ANRE). For FY2024 it is called the “overall average price,” and for FY2025 the “overall average unit price after transitional measures.” Both are averages after the transitional measures are reflected. From FY2026 onward, the average was calculated on the same basis by dividing the total clearing amount by the total cleared capacity.
The total clearing amount for delivery year FY2029, ¥2.2094 trillion, is about 2.6 times the ¥842.5 billion for FY2026.
Changes in key figures during the period of rising prices
Clearing prices have kept rising since bottoming for delivery year FY2025. OCCTO’s clearing results materials do not attribute the rise to a single factor. This section shows the changes in the figures in those materials.
| Delivery year | Net CONE (¥/kW) | Target procurement volume (GW) | Weighted average bid price (¥/kW) | Share of capacity bid above Net CONE |
|---|---|---|---|---|
| FY2024 | 9,425 | 177.47 | 2,182 | 11.7% |
| FY2025 | 9,372 | 176.99 | 1,313 | 2.9% |
| FY2026 | 9,557 | 178.30 | 1,634 | 2.3% |
| FY2027 | 9,769 | 184.47 | 1,645 | 1.7% |
| FY2028 | 9,875 | 186.16 | 2,097 | 6.8% |
| FY2029 | 10,075 | 189.97 | 2,621 | 11.2% |
(Sources: Net CONE and target procurement volume from the clearing results for FY2029, PDF p.41. Bid prices from the clearing results for each year: for FY2024, clearing results (September 14, 2020), PDF pp.17–18; for FY2025, clearing results (December 22, 2021), PDF pp.26–27.)
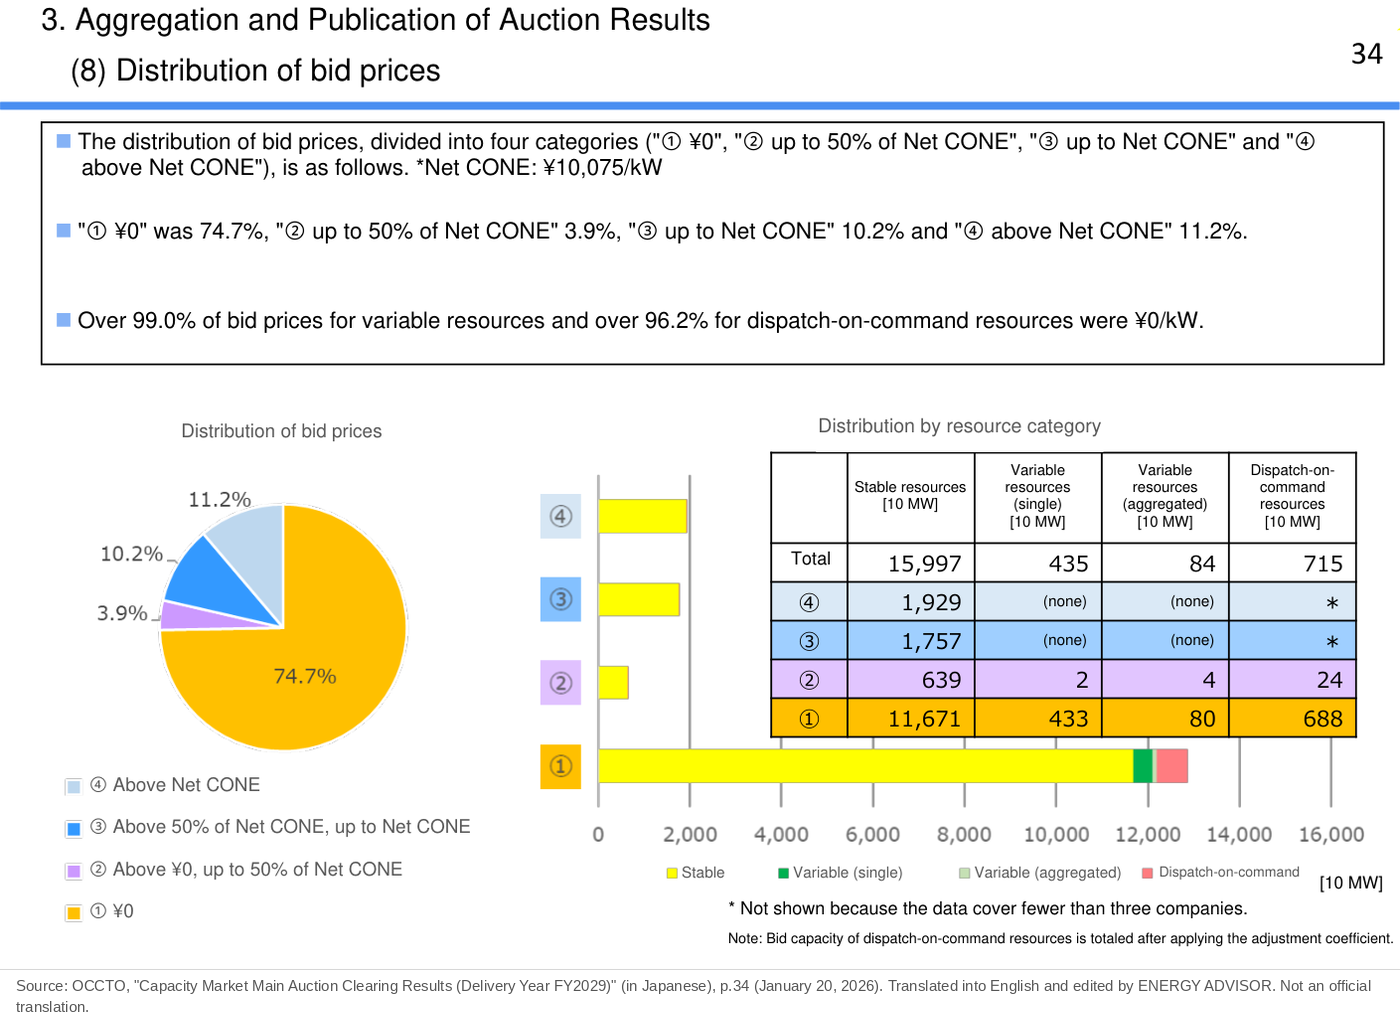
The target procurement volume increased by about 11.7 GW from FY2026 to FY2029. Over the same period, the share of capacity bid above Net CONE rose from 2.3% to 11.2%. In the first auction, for FY2024, the share was also high at 11.7%; it had fallen to 2.9% in the next auction, for FY2025.
Transitional Measures and How They Changed
The transitional measures reduce payments to older plants and others so that the burden on retail electricity suppliers does not rise abruptly right after the capacity market is introduced. The amount reduced is deducted from the capacity contributions paid by retail electricity suppliers.
For FY2024 (the first auction)
The capacity payments for resources built by the end of FY2010 were reduced by applying a 42% deduction rate. About 77% of all winning resources were subject to the transitional measures; the price for the resources subject to them was ¥8,199/kW, and the overall average price was ¥9,533/kW (Study Committee on the Capacity Market, 35th meeting, Material 3-2, PDF p.3).
From FY2025 onward
Following the first results, the mechanism was revised to combine the following two deductions (same, PDF p.4).
- Deduction by age of the resource: the capacity payment for resources built by the end of FY2010 is reduced at a set deduction rate
- Deduction based on bid content: the capacity payment is reduced for resources whose bid price was at or below “clearing price × a set coefficient”
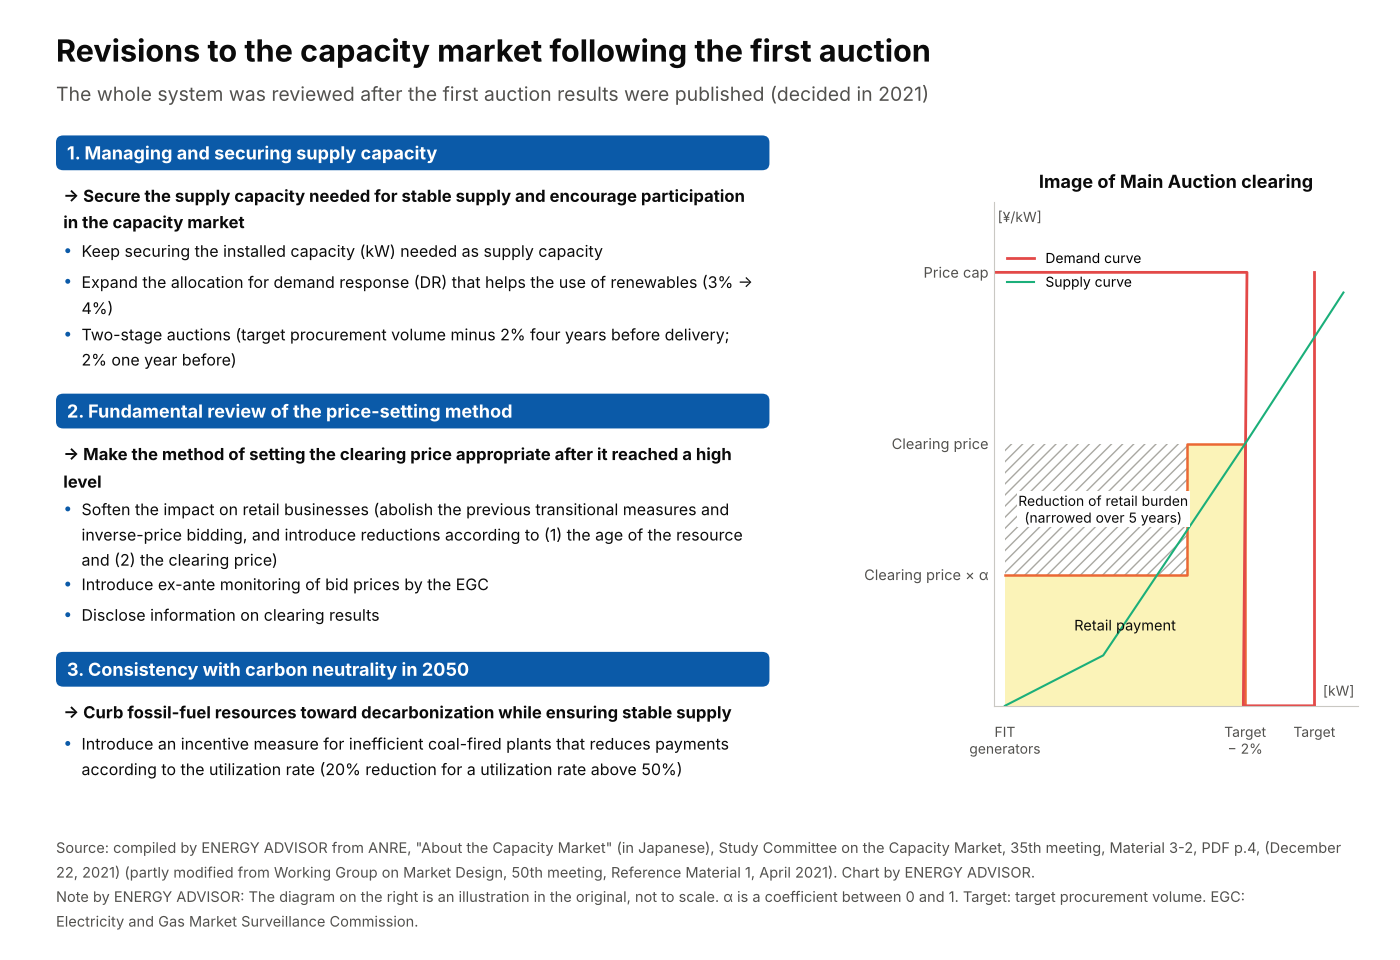
The deduction rates and coefficients are set so that the transitional measures shrink year by year.
| Delivery year | Deduction rate by age | Coefficient for the deduction based on bid content |
|---|---|---|
| FY2026 | 6.0% | 85.6% |
| FY2027 | 4.5% | 89.2% |
| FY2028 | 3.0% | 92.8% |
| FY2029 | 1.5% | 96.4% |
(Sources: glossaries in the clearing results for each year; for FY2027, 76th meeting of the committee, Material 3, PDF p.11)
In addition, no deduction is made if a resource’s clearing price is 50% or less of the indicative price. If the deduction would bring it below 50%, the deduction is adjusted so that it stays at 50%. This rule does not apply to resources contracted in the Main Auction for delivery year FY2025 (76th meeting of the committee, Material 3, PDF p.11).
From delivery year FY2030, the transitional measures have been abolished. In the Main Auction Guidelines for FY2030, the chapter on transitional measures is marked “deleted” (Main Auction Guidelines (Delivery Year FY2030), PDF p.38; the policy to abolish them is in the 74th meeting of the committee, Material 3, PDF p.7).
Changes for the Next Auction (Delivery Year FY2030)
The guidelines and demand curve for the FY2026 Main Auction (delivery year FY2030) were published on July 30, 2026. The values of the demand curve are the same as in the June 30 draft. Bidding takes place from October 13 to 23, 2026, and the clearing results are scheduled to be published around December (Guidelines (Delivery Year FY2030), PDF p.9).
| Item | Delivery year FY2029 | Delivery year FY2030 (final) |
|---|---|---|
| Net CONE | ¥10,075/kW | ¥20,911/kW |
| Price cap (1.5 times Net CONE) | ¥15,112.5/kW | ¥31,366.5/kW |
| Target procurement volume | 189.97 GW | 196.91 GW |
| Multi-price measure | Yes (portion above 1.5 times the adjacent area) | No. Clears at a single price. If the clearing price exceeds the indicative price, the clearing price for resources that bid at or below the indicative price is the indicative price |
| Allocation left for the Incremental Auction (2% of H3 demand) | Procured in the Incremental Auction | Not left over; procured in the Main Auction |
| Transitional measures | Yes (deduction rate of 1.5%, etc.) | No |
(Sources: FY2026 Main Auction Demand Curve (July 30, 2026), PDF p.3; Guidelines (Delivery Year FY2030), PDF pp.33 and 38; 74th meeting of the committee, Material 3, PDF pp.6–7. In the demand curve for FY2030, the supply capacity added in the clearing process consists of three items: FIT resources, etc.; expected capacity outside the capacity market; and the Long-Term Decarbonized Capacity Auction. The item for supply capacity planned to be procured in the Incremental Auction has been removed.)
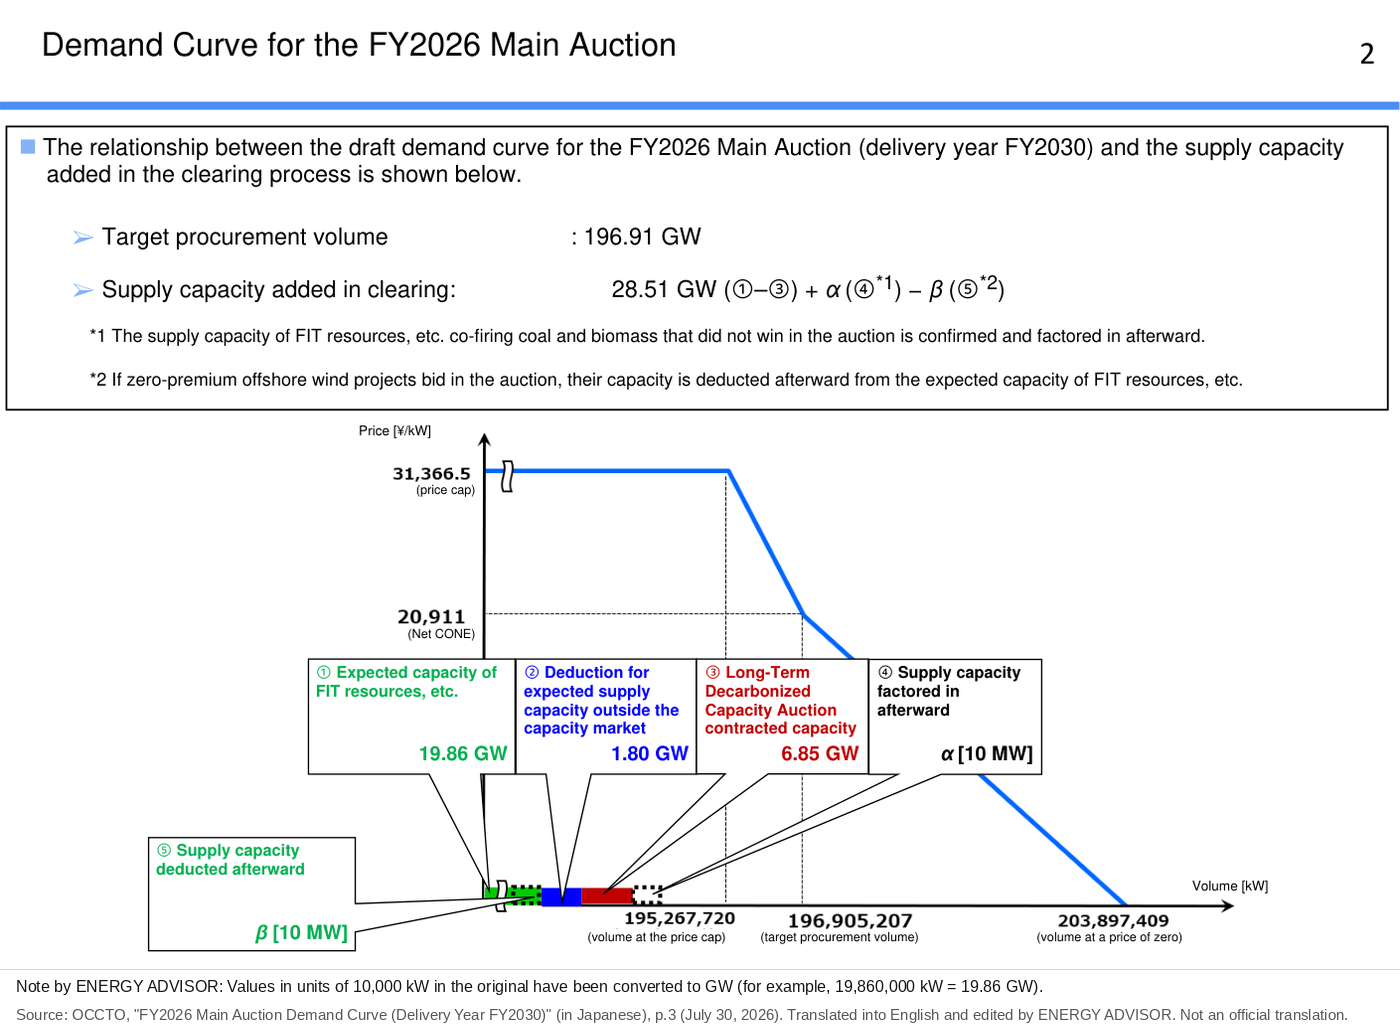
The parameters used to calculate Net CONE were updated to the values published by the Power Generation Cost Verification Working Group in February 2025. The base year of the model plant changed from 2014 to 2023. Revenue from sources other than the capacity market was also revised from ¥5,190/kW to ¥10,772/kW (demand curve, PDF p.5; 74th meeting, Material 4, PDF pp.9–10).
Raising the indicative price works to increase the burden of capacity contributions. Measures to soften that effect were discussed at the government advisory council and the study committee (72nd meeting of the committee, Material 4, March 27, 2026). Removing the multi-price measure, and the clearing rule that caps bids at or below the indicative price at the indicative price, were added to the guidelines as a result of this discussion (74th meeting, Material 3, PDF p.6).
Summary
- The Main Auction is open to resources in four categories: stable resources, variable resources (single / aggregated) and dispatch-on-command resources. FIT and FIP resources cannot take part, in principle.
- OCCTO builds the demand curve from the target procurement volume and Net CONE, and the clearing price is set where it meets the supply curve. When the market is split by interconnection constraints, prices differ by area.
- The clearing prices (area prices) of the six auctions were ¥14,137/kW for FY2024 and ¥3,495–5,242/kW for FY2025. They then kept rising, reaching ¥12,388–15,112/kW for FY2029. The total clearing amount for FY2029 was ¥2.2094 trillion.
- The deduction rate of the transitional measures shrank from 42% (FY2024) to 1.5% (FY2029), and the measures were abolished for FY2030.
- For the next auction (delivery year FY2030), Net CONE roughly doubles to ¥20,911/kW, and the multi-price measure has been removed. Bidding takes place in October 2026, and results are scheduled to be published around December.
This article is based on published materials from the Ministry of Economy, Trade and Industry and its Agency for Natural Resources and Energy, the Electricity and Gas Market Surveillance Commission, the Organization for Cross-regional Coordination of Transmission Operators (OCCTO) and other sources. The English translations of figures are by ENERGY ADVISOR and are not official translations. When using this information for decisions, please check the original sources. When we find an error, we correct the article and note the date of the correction.
Sources
- Study Committee on the Capacity Market, 35th meeting, Material 3-2, “About the Capacity Market” (ANRE) (in Japanese), PDF p.2 (FY2025), p.3 (FY2024, 42% transitional measures), p.4 (revisions), December 22, 2021. https://www.occto.or.jp/assets/iinkai/youryou/kentoukai/2021/files/youryou_kentoukai_35_03_2.pdf
- OCCTO, “Capacity Market Main Auction Clearing Results (Delivery Year FY2026)” (in Japanese), PDF p.8 (transitional measures), p.9 (overview), pp.29–30 (bid prices), January 25, 2023. https://www.occto.or.jp/assets/market-board/market/oshirase/2022/files/230125_mainauction_youryouyakujokekka_kouhyou_jitsujukyu2026.pdf
- OCCTO, “Review Report on the Capacity Market Main Auction Clearing Results (Delivery Year FY2027)” (in Japanese), PDF p.4 (clearing results), p.18 (weighted average bid price), p.22 (distribution of bid prices), p.31 (Table 22), June 12, 2024. https://www.occto.or.jp/assets/market-board/market/oshirase/2024/files/240612_mainauction_kensyoreport_jitsujukyu2027.pdf
- OCCTO, “Capacity Market Main Auction Clearing Results (Delivery Year FY2028)” (in Japanese), PDF p.8 (transitional measures), p.9 (overview), pp.30–31 (bid prices), January 29, 2025. https://www.occto.or.jp/assets/market-board/market/oshirase/2024/files/250129_mainauction_youryouyakujokekka_kouhyou_jitsujukyu2028.pdf
- OCCTO, “Capacity Market Main Auction Clearing Results (Delivery Year FY2029)” (in Japanese), PDF p.5 (schedule), pp.6–8 (glossary; definition of supply reliability on p.7), pp.9–10 (clearing results), pp.33–34 (bid prices), p.41 (trends in Net CONE and target procurement volume), January 20, 2026. https://www.occto.or.jp/assets/news/capacity-market/260120_mainauction_youryouyakujokekka_kouhyou_jitsujukyu2029.pdf
- Study Committee on the Capacity Market, 76th meeting, Material 3, “Capacity Market Incremental Auction Clearing Results (Delivery Year FY2027)” (in Japanese), PDF p.11 (item 5 of the transitional measures), August 6, 2026. https://www.occto.or.jp/assets/iinkai/youryou_kentoukai/76/youryou_kentoukai_76_03.pdf
- OCCTO, “Capacity Market Main Auction Guidelines (Delivery Year FY2030)” (in Japanese), PDF p.9 (schedule), p.33 (method of determining the clearing price), p.38 (deletion of transitional measures), July 30, 2026. https://www.occto.or.jp/assets/market-board/market/jitsujukyukanren/260730_mainauction_boshuyoukou_jitsujukyu2030.pdf
- OCCTO, “FY2026 Main Auction Demand Curve (Delivery Year FY2030)” (in Japanese), PDF p.3, p.5, July 30, 2026. https://www.occto.or.jp/assets/market-board/market/jitsujukyukanren/260730_mainauction_jyuyoukyokusen_jitsujukyu2030.pdf
- Study Committee on the Capacity Market, 72nd meeting, Material 4, “Calculation of the Capacity Market Demand Curve (Treatment of Net CONE)” (in Japanese), March 27, 2026. https://www.occto.or.jp/assets/iinkai/youryou_kentoukai/72/youryou_kentoukai_72_04.pdf
- Study Committee on the Capacity Market, 74th meeting, Material 3, “Start of Public Consultation on the Draft FY2026 Main Auction Guidelines (Delivery Year FY2030)” (in Japanese), PDF pp.6–7, June 30, 2026. https://www.occto.or.jp/assets/iinkai/youryou_kentoukai/74/youryou_kentoukai_74_03.pdf
- Study Committee on the Capacity Market, 74th meeting, Material 4, “Draft Demand Curve for the FY2026 Main Auction (Delivery Year FY2030)” (in Japanese), PDF p.6, pp.9–11, June 30, 2026. https://www.occto.or.jp/assets/iinkai/youryou_kentoukai/74/youryou_kentoukai_74_04.pdf
- OCCTO, “FY2022 Main Auction Demand Curve Preparation Guidelines” (in Japanese) (source of a figure in the original article). https://www.occto.or.jp/assets/market-board/market/jitsujukyukanren/files/220727_mainauction_jyuyoukyokusen_sakuseiyouryou_jitsujukyu2026.pdf
- Study Committee on the Capacity Market, 23rd meeting, Materials 4 and 5 (approach to the demand curve and clearing process) (in Japanese) (sources of figures in the original article). https://www.occto.or.jp/assets/iinkai/youryou/kentoukai/2019/files/youryou_kentoukai_23_04.pdf / https://www.occto.or.jp/assets/iinkai/youryou/kentoukai/2019/files/youryou_kentoukai_23_05.pdf
- OCCTO, “Capacity Market Main Auction Clearing Results (Delivery Year FY2024)” (in Japanese), PDF p.17 (weighted average bid price), p.18 (distribution of bid prices), September 14, 2020. https://www.occto.or.jp/market-board/market/oshirase/2020/files/200914_mainauction_youryouyakujokekka_kouhyou_jitsujukyu2024.pdf
- Study Committee on the Capacity Market, 35th meeting, Material 3-1, “Capacity Market Main Auction Clearing Results (Delivery Year FY2025)” (in Japanese), PDF p.1 (publication date), p.26 (weighted average bid price), p.27 (distribution of bid prices), December 22, 2021. https://www.occto.or.jp/iinkai/youryou/kentoukai/2021/files/youryou_kentoukai_35_03_1.pdf
- OCCTO, “Capacity Market Main Auction Clearing Results (Delivery Year FY2027)” (in Japanese), PDF p.9 (total cleared capacity and total clearing amount), January 24, 2024. https://www.occto.or.jp/market-board/market/oshirase/2023/files/240124_mainauction_youryouyakujokekka_kouhyou_jitsujukyu2027.pdf
- OCCTO, “About the Capacity Market Main Auction” (briefing material) (in Japanese), PDF p.56 (demand curve), pp.57–58 (method of determining the clearing price; market splitting), July 2026. https://www.occto.or.jp/www.occto.or.jp/news/20260708_youryou_seidosetsumei.pdf
- OCCTO, “FY2022 Main Auction Demand Curve (Delivery Year FY2026)” (in Japanese), PDF p.3 (source of a figure in the original article). https://www.occto.or.jp/assets/market-board/market/jitsujukyukanren/files/220727_mainauction_jyuyoukyokusen_jitsujukyu2026.pdf
- OCCTO, “Overview of the Capacity Market” (briefing material) (in Japanese), PDF p.18, June 2022 (source of a figure in the original article). https://www.occto.or.jp/assets/market-board/market/files/202206_youryou_gaiyousetsumei.pdf