In the Long-Term Decarbonized Capacity Auction, a price cap is set for each resource type, and bids must be at or below the cap. The costs that may be included in bid prices are also specified, and the Electricity and Gas Market Surveillance Commission (EGC; the regulator that monitors electricity trading) monitors each candidate winning project. Winning companies receive capacity revenue at the level of fixed costs and, in return, refund most of the revenue they earn in wholesale and other markets. This article explains how bid prices and price caps are set, the actual winning prices, and how company revenue and refunds work. The overall design of the scheme is explained in the eighth article of this series.
Approach to Bid Prices
Why bid prices are subject to certain rules
The Working Group on Market Design’s 8th Interim Report (October 2022) organized the approach to bid prices as follows.
- In the Main Auction, there are companies with market power. To prevent price manipulation, bidding guidelines show the approach to bid prices that do not constitute manipulation.
- The Long-Term Decarbonized Capacity Auction covers new investment in decarbonized power sources. Unlike the Main Auction, where some companies hold many existing plants, there are basically no companies with market power. It was therefore concluded that rules designed with market-power holders in mind are not needed.
- On the other hand, it is a scheme that decides winners by bidding. To minimize the burden on the public, it was concluded that rules such as “setting price caps” and “monitoring bid prices” must apply to all companies.
Costs that may be included in bid prices
The bid price (¥/kW-year) must be at or below the amount given by the following formula (Overview of the Long-Term Decarbonized Capacity Auction (Bidding Year FY2026), PDF p.25).
Bid price = (eligible costs for bid prices (¥/year) − other-market revenue at the time of bidding (¥0 for all resources)) ÷ bid volume (kW)
Eligible costs for bid prices are annual average costs, obtained by dividing by the number of years in the support period (the period of receiving capacity revenue), and fall into the following three categories.
| Category | Main costs |
|---|---|
| Capital costs | Construction costs, grid connection costs, decommissioning costs, fixed asset tax |
| O&M costs | Personnel costs, repair costs, the generation-side network charge (a grid usage charge paid by generators), enterprise tax, other (outsourcing, consumables, etc.). For hydrogen and ammonia, variable costs may be included up to a 40% capacity factor, limited to the price difference from LNG or coal fuel costs. Variable costs for CCS may also be included up to a 40% capacity factor |
| Cost of capital | The WACC (weighted average cost of capital; the average rate of the funding costs of debt and equity) set according to the commissioning deadline |
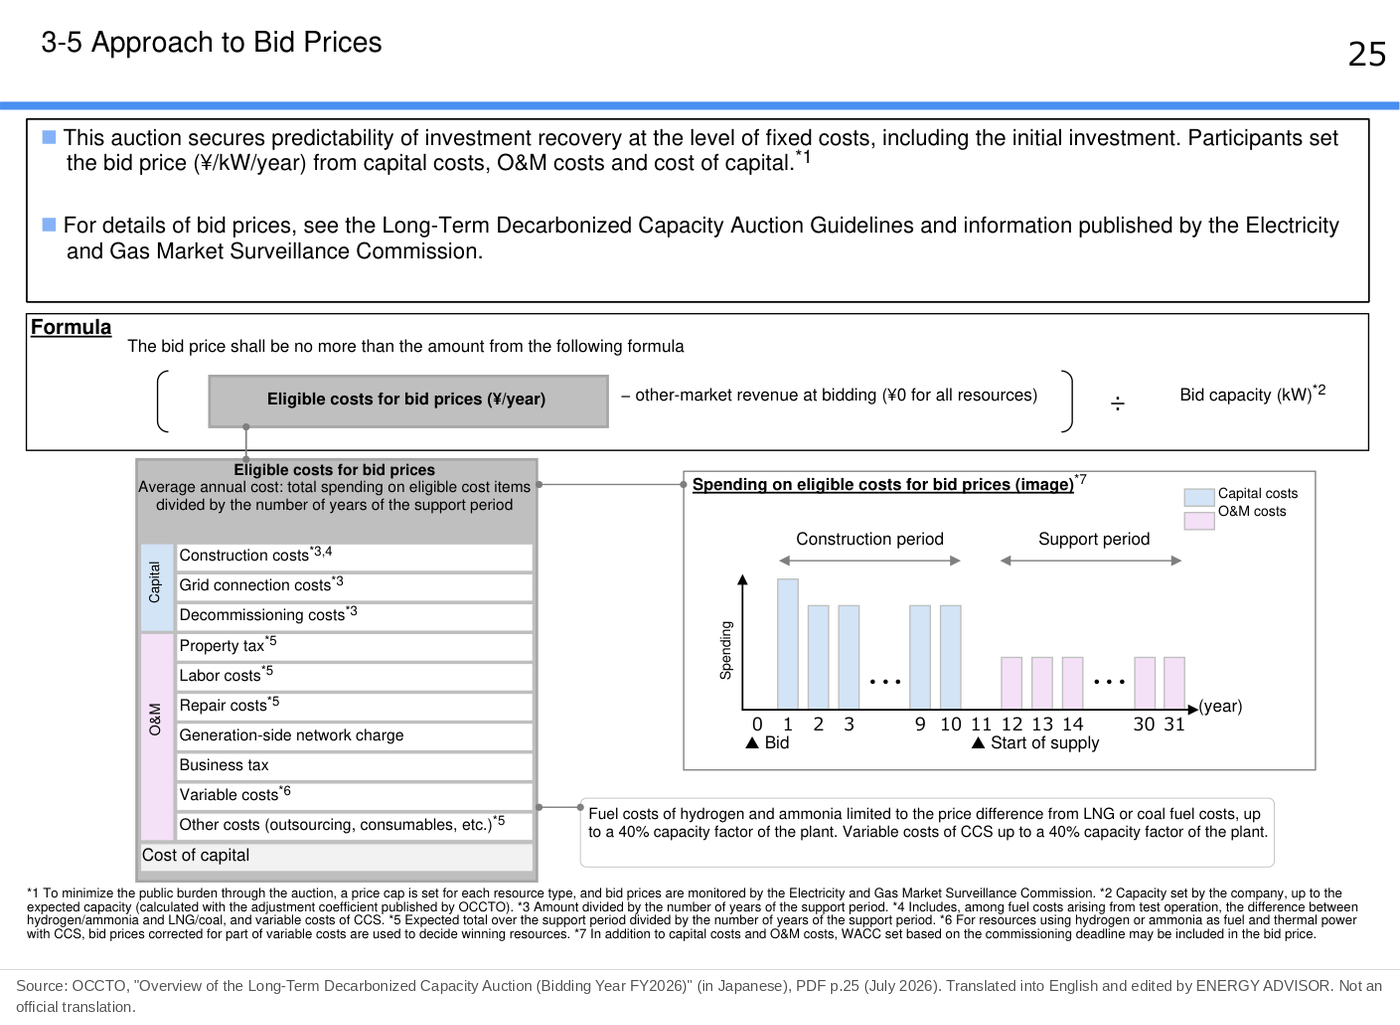
Other-market revenue at the time of bidding is set at ¥0 for all resources. This is because revenue from other markets is refunded after it has actually been earned (see below).
Capacity revenue continues for, in principle, 20 years or more. Prices and interest rates may change significantly during that time. Bid prices therefore do not include a premium for the risk of price changes. Changes in prices and interest rates are reflected in the contract unit price after the fact. The method of adjustment is declared at the time of bidding (Long-Term Decarbonized Capacity Auction Guidelines (Bidding Year FY2026), PDF p.9, September 2, 2026).
Requirements for the cost of capital (WACC)
For FY2026 (April 2026–March 2027) bidding, the WACC used to calculate the cost of capital now has three tiers depending on the length of the commissioning deadline (overview, PDF p.43).
| Commissioning deadline | WACC |
|---|---|
| Resource types with less than 5 years | 4.5% |
| Resource types with 5 years to less than 10 years | 5.5% |
| Resource types with 10 years or more | 6.5% |
The base WACC for bidding year FY2026 used in the interest rate adjustment formula, part of the automatic adjustment of winning prices, is 5.5%.
Approach to Price Caps and Changes for FY2026
Approach to price caps
Bid prices have a price cap for each resource type, which also differs between new build, repowering and retrofits. A resource that bids above the price cap is treated as not awarded.
Price caps are based on the figures in the government’s Power Generation Cost Verification. The Power Generation Cost Verification is a report by METI’s Power Generation Cost Verification Working Group that compiles construction and operating costs by type of power source. The caps are set considering both encouraging new plants and minimizing the burden on the public.
Price caps for FY2026
The main price caps in the FY2026 guidelines (final version of September 2, 2026) are as follows (Long-Term Decarbonized Capacity Auction Guidelines (Bidding Year FY2026), PDF pp.18–19). The values are the same as in the draft put out for public consultation.
| Resource type | New build | Repowering, etc. / retrofit |
|---|---|---|
| Solar | ¥101,396–200,000/kW-year (by area) | Same as left |
| Onshore wind | ¥109,547–200,000/kW-year (by area) | Same as left |
| Offshore wind | ¥345,220–701,172/kW-year (by area) | Same as left |
| Hydropower (excluding pumped storage) | ¥192,739/kW-year | ¥83,778/kW-year |
| Pumped storage | ¥200,000/kW-year | In the ¥70,000s/kW-year (by area) |
| Battery storage | In the ¥70,000s/kW-year (by area) | Same as left |
| Long-duration energy storage | ¥200,000/kW-year | Same as left |
| Nuclear (including safety upgrades of existing plants) | ¥193,810/kW-year | Same as left |
| Geothermal | ¥126,236/kW-year | Full replacement type ¥97,104/kW-year; reuse of underground facilities type ¥58,262/kW-year |
| Biomass | ¥100,000/kW-year | Same as left (also for retrofits to dedicated biomass) |
| Thermal power co-firing 10% or more hydrogen | ¥132,666/kW-year | ― |
| Dedicated hydrogen thermal power | ¥739,104/kW-year | ― |
| Dedicated ammonia thermal power | ¥289,200/kW-year | ― |
| LNG-only thermal plants | ¥92,068/kW-year if an LNG terminal must be developed; ¥65,284/kW-year if not | Same as left |
| Retrofit of existing thermal plants to 10% or more hydrogen co-firing or dedicated hydrogen | ― | ¥703,352/kW-year |
| Retrofit of existing thermal plants to 20% or more ammonia co-firing or dedicated ammonia | ― | ¥353,563/kW-year |
| Retrofit of existing coal-fired plants with CCS (20% or more) | ― | ¥324,582/kW-year |
| Retrofit of existing LNG-fired plants with CCS (20% or more) | ― | ¥114,926/kW-year |
(The full replacement type replaces all surface facilities, production wells and reinjection wells; the reuse of underground facilities type continues to use some or all of the wells.)
As changes for FY2026 (compared with FY2025), the price caps for long-duration energy storage, conventional hydropower, pumped storage (new build only) and nuclear changed from 1.5 times to 2 times the cost parameters. For LNG-only thermal plants, separate price caps now apply to plants that newly develop an LNG terminal (LNG tanks, jetties, etc.) and to those that do not (overview, PDF p.43).
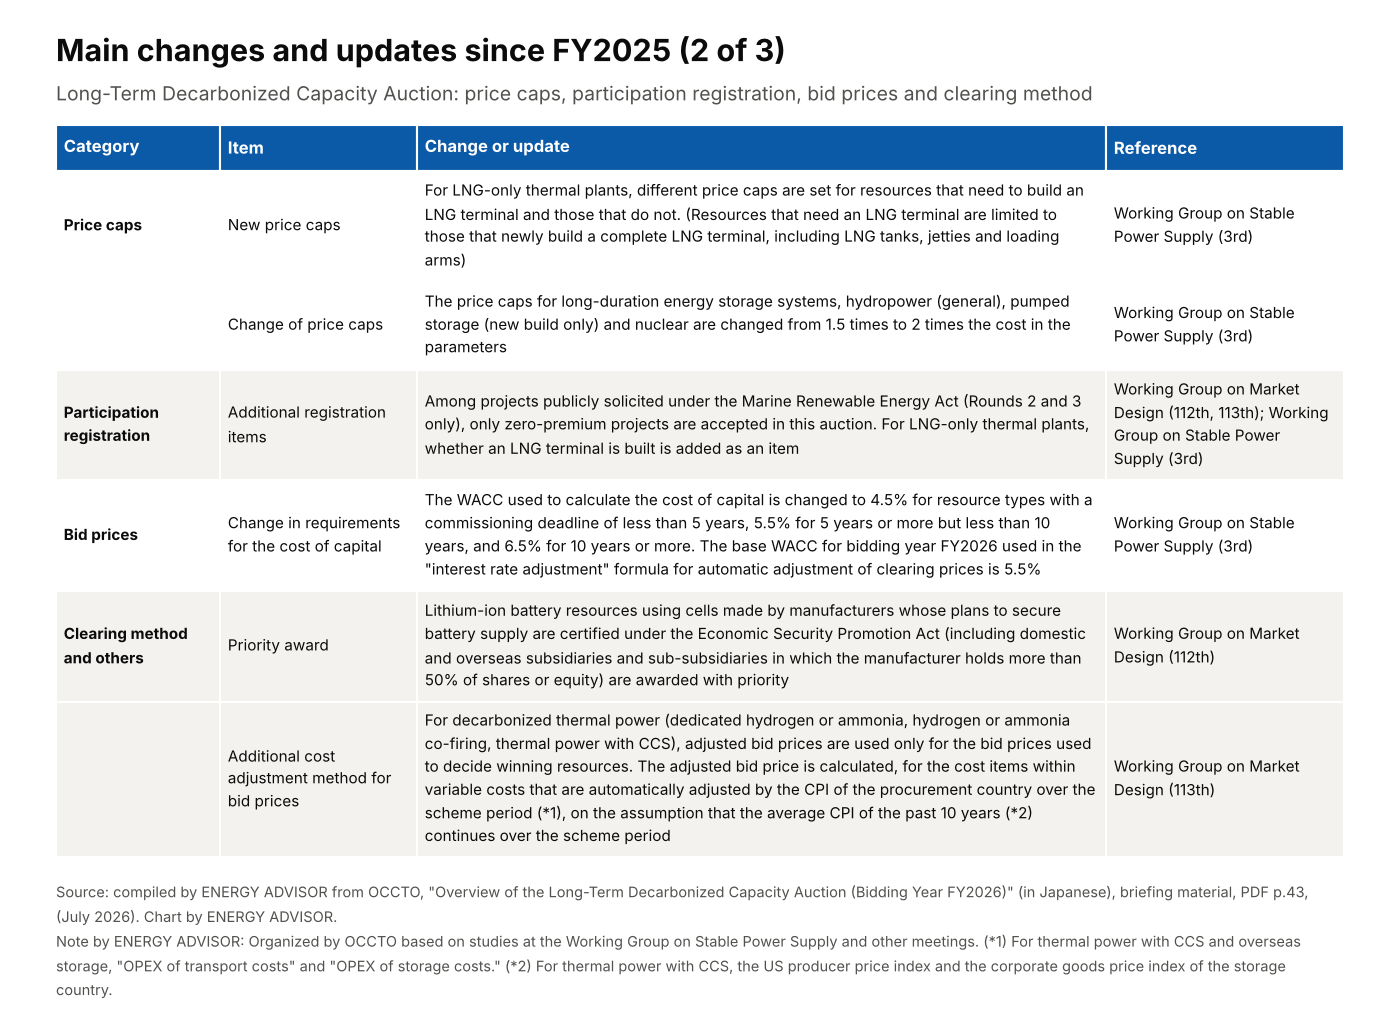
In the original article (FY2023), price caps were capped at ¥100,000/kW-year. Resource types whose value calculated from the Power Generation Cost Verification exceeded ¥100,000/kW-year were set at ¥100,000/kW-year. In the guidelines for bidding year FY2024 (the second round), the caps for solar, wind, geothermal, biomass and others were also ¥100,000/kW-year (Long-Term Decarbonized Capacity Auction Guidelines (Bidding Year FY2024), PDF pp.17–18). From the guidelines for bidding year FY2025 (the third round), price caps above ¥100,000/kW-year were set, such as up to ¥200,000/kW-year for solar and ¥795,735/kW-year for dedicated hydrogen thermal power (same (Bidding Year FY2025), PDF pp.18–19). For FY2026, too, many price caps above ¥100,000/kW-year have been set. This article has not confirmed how the deliberations on changing the treatment of the cap proceeded.
Monitoring of Bid Prices by the EGC
After bidding closes, the EGC monitors the bid prices of candidate winning resources. Monitoring is based on the bid forms submitted by companies and follows the government guideline. Where necessary, the EGC holds hearings and asks for explanations of how bid prices were calculated and on what basis. It also asks for supporting documents (contracts, quotations, etc.).
If monitoring finds amounts in individual cost items that cannot be included in the bid price, the company and OCCTO are notified (notice of disallowed costs).
A company that receives a notice of disallowed costs recalculates its bid price to reflect the notice. After confirmation by the EGC, it applies to OCCTO to revise its bid price. If some costs are disallowed and the company judges that recovering its investment will be difficult, it can also withdraw its bid. This revision and withdrawal mechanism is also written into the FY2026 guidelines (Long-Term Decarbonized Capacity Auction Guidelines (Bidding Year FY2026), PDF p.34, items (12)–(13)). The deadline for applying (within 14 days of the notice) is from the FY2023 monitoring briefing material.
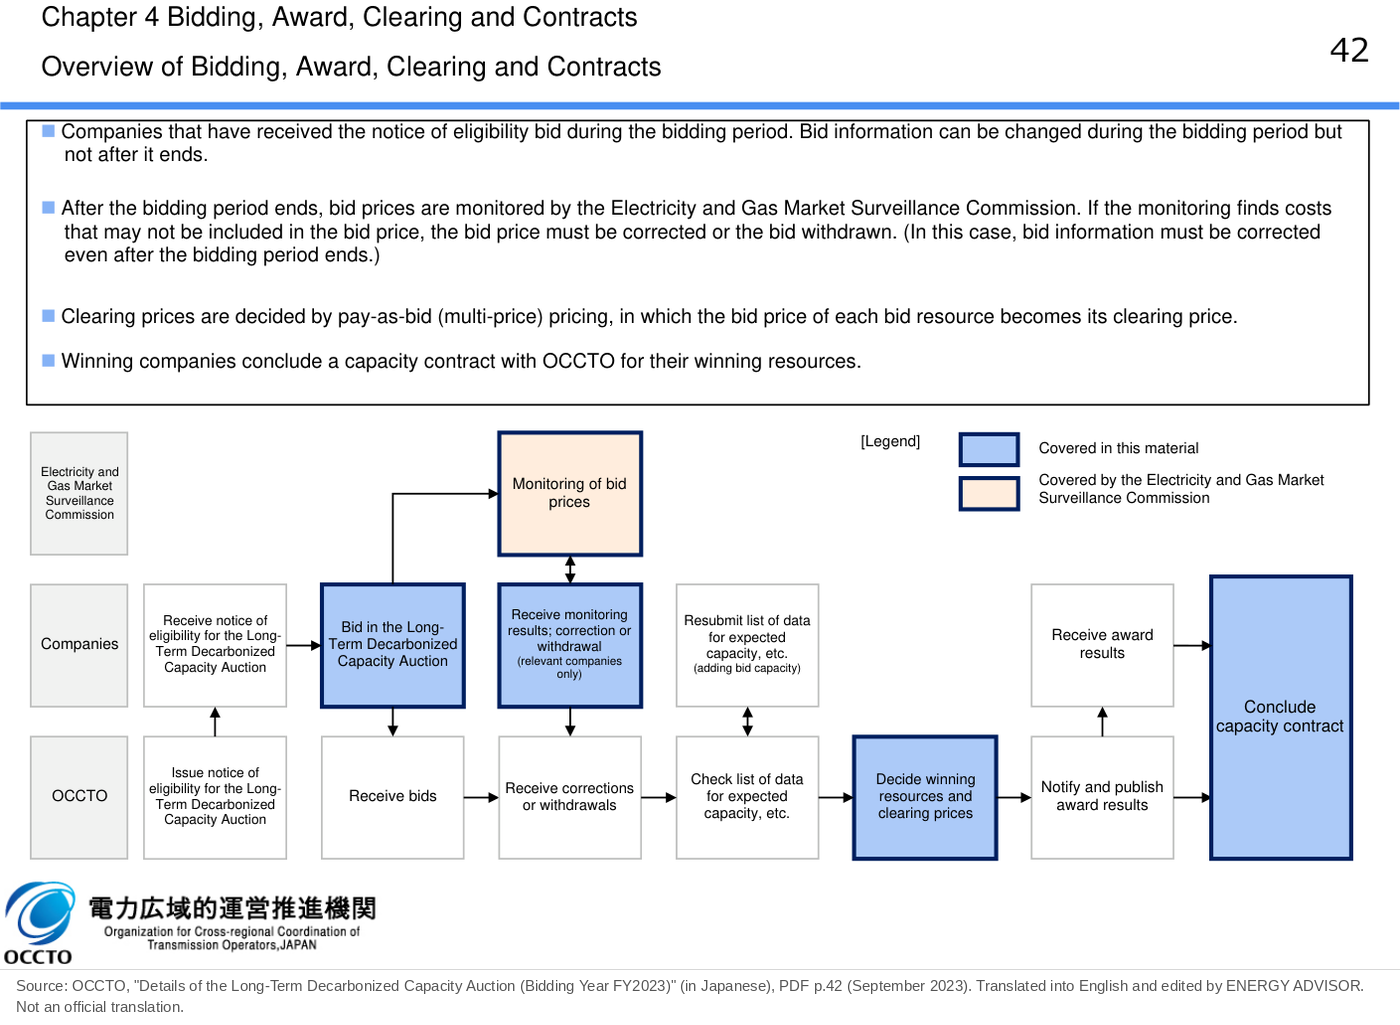
The clearing results of all three rounds reflect revisions of bid prices and withdrawals of bids resulting from the EGC’s monitoring (note in Study Committee on the Capacity Market, 73rd meeting, Material 3, PDF p.14).
Actual Winning Prices (First to Third Rounds)
Because pay-as-bid pricing is used, winning prices differ by resource. The published total clearing amounts and total awarded capacities are as follows.
| Round (bidding year) | Category | Total awarded capacity | Total clearing amount | Average winning price |
|---|---|---|---|---|
| 1st (FY2023) | Decarbonized power sources | 4,010 MW | ¥233.6 billion per year | ¥58,000/kW-year |
| 1st (FY2023) | LNG-only thermal plants | 5,756 MW | ¥176.6 billion per year | ¥30,000/kW-year |
| 2nd (FY2024) | Decarbonized power sources | 5,030 MW | ¥346.4 billion per year | About ¥69,000/kW-year (calculated) |
| 2nd (FY2024) | LNG-only thermal plants | 1,315 MW | ¥45.6 billion per year | About ¥35,000/kW-year (calculated) |
| 3rd (FY2025) | Decarbonized power sources | 4,261 MW | ¥474.8 billion per year | About ¥111,000/kW-year (calculated) |
| 3rd (FY2025) | LNG-only thermal plants | 3,038 MW | ¥144.4 billion per year | About ¥48,000/kW-year (calculated) |
(Sources: 1st round, Working Group on Market Design, 92nd meeting, Material 3-3 (ANRE), slide 7 (weighted average clearing price); 2nd round, Long-Term Decarbonized Capacity Auction Clearing Results (Bidding Year FY2024), PDF p.12; 3rd round, 73rd meeting of the study committee, Material 3, PDF p.14. The 2nd- and 3rd-round averages are calculated by dividing the total clearing amount by the total awarded capacity. The total clearing amount is the sum for resources with different delivery years and is not a constant value over the support period.)
For Round 3, ANRE gave weighted-average clearing prices of ¥111,000/kW-year for decarbonized power sources and ¥46,000/kW-year for LNG-only thermal plants (Working Group on Stable Power Supply, 1st meeting, Material 7-3, p.13). The Round 3 values in the table are calculated by dividing the total clearing amount by the total awarded capacity, so for LNG-only thermal plants they do not match the weighted average (¥46,000).
Winning prices by resource type are not published. For this reason, published materials do not show which resource types account for the differences in the averages between rounds.
Company Revenue and Refund of Other-Market Revenue
Form of revenue
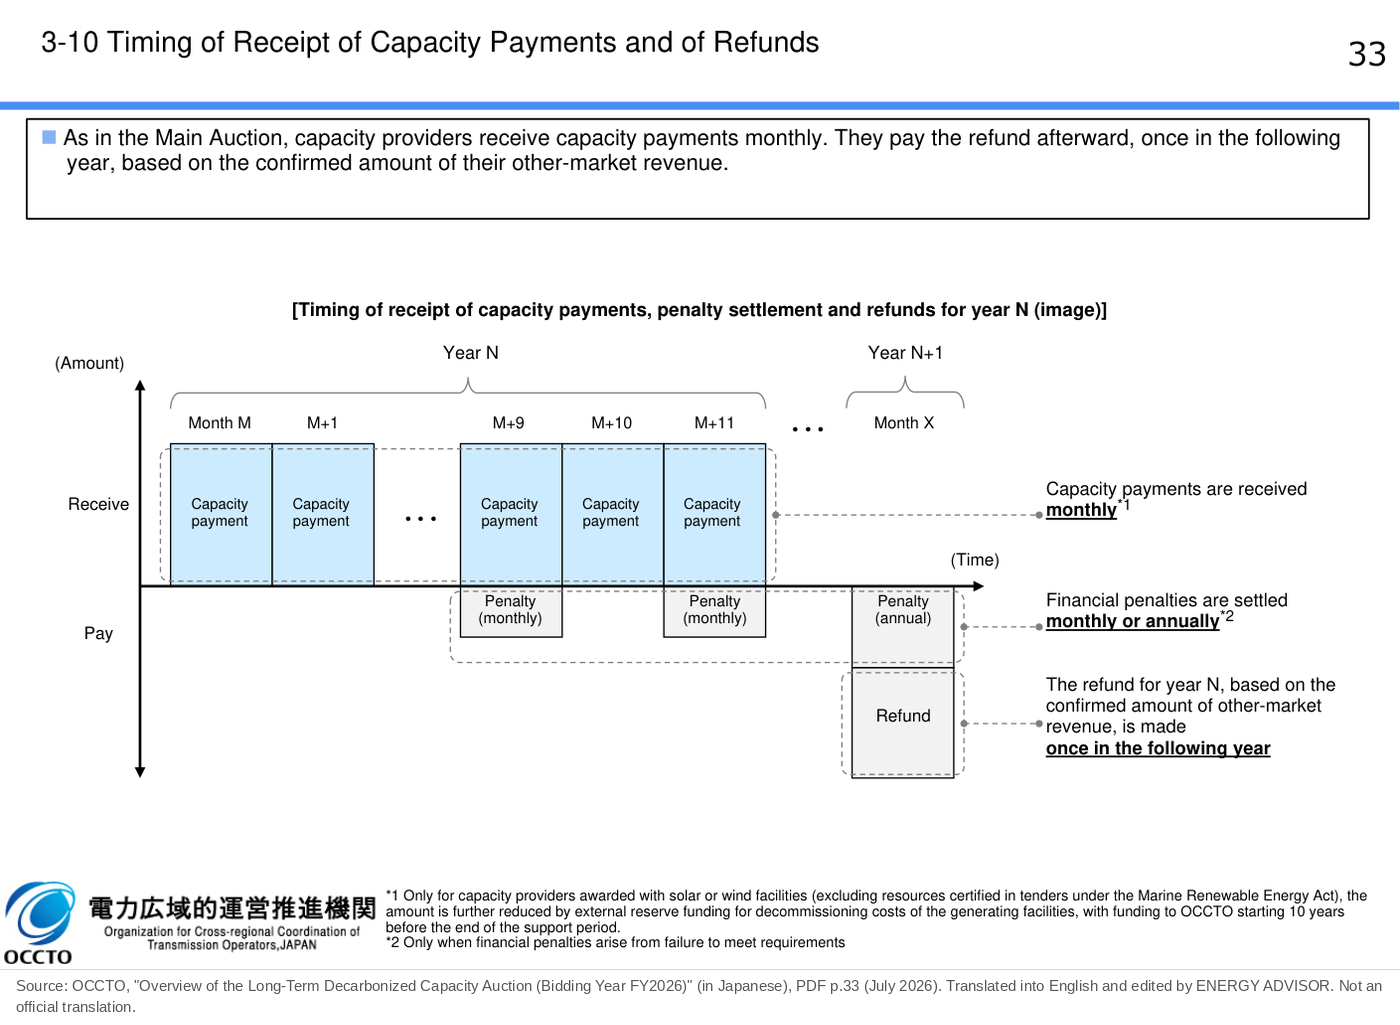
Winning companies are paid monthly by OCCTO a capacity payment at the level of fixed costs (contract unit price × contracted capacity), according to their compliance with the requirements. The amount may change due to adjustments for changes in prices and interest rates.
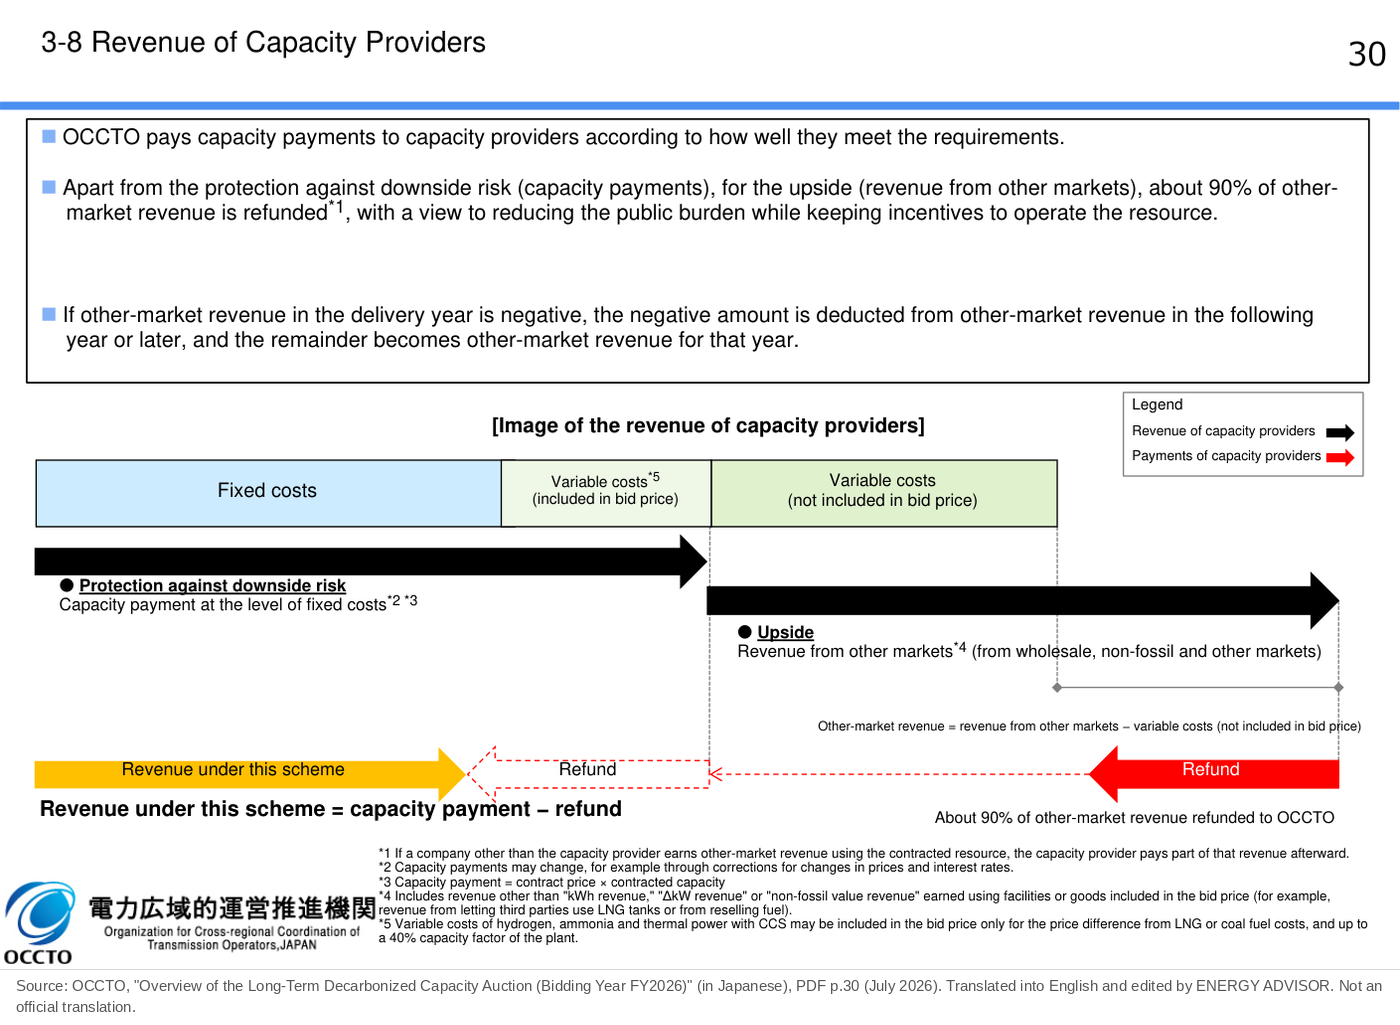
Companies can also earn revenue from the wholesale electricity market, the non-fossil value trading market, the Supply and Demand Balancing Market (balancing market) and other markets using their newly built or repowered resources. However, they refund to OCCTO, once in the following fiscal year, about 90% of “other-market revenue,” which is revenue from other markets minus variable costs (the part not included in the bid price) (overview, PDF pp.30 and 33).
Revenue under this scheme = capacity payment − refund
Because other-market revenue is set at ¥0 and the cost of capital is included when bid prices are calculated, the scheme refunds about 90% of other-market revenue after the fact. If other-market revenue in a fiscal year is negative, the negative amount is deducted from other-market revenue in the following and later fiscal years.
Refund ratio (three tiers)
The refund ratio has three tiers, to encourage capacity providers to operate rationally, for example by running when market prices are high and procuring fuel cheaply (overview, PDF p.32).
| Range | Refund ratio | Description |
|---|---|---|
| (A) | 95% | Range reflecting that the cost of capital is obtained as capacity revenue |
| (C) | 90% | Range between (A) and (B) |
| (B) | 85% | Range in which revenue under this scheme is lower than the revenue the resource would have earned had it won in the Main Auction (Main Auction price × contracted capacity) |
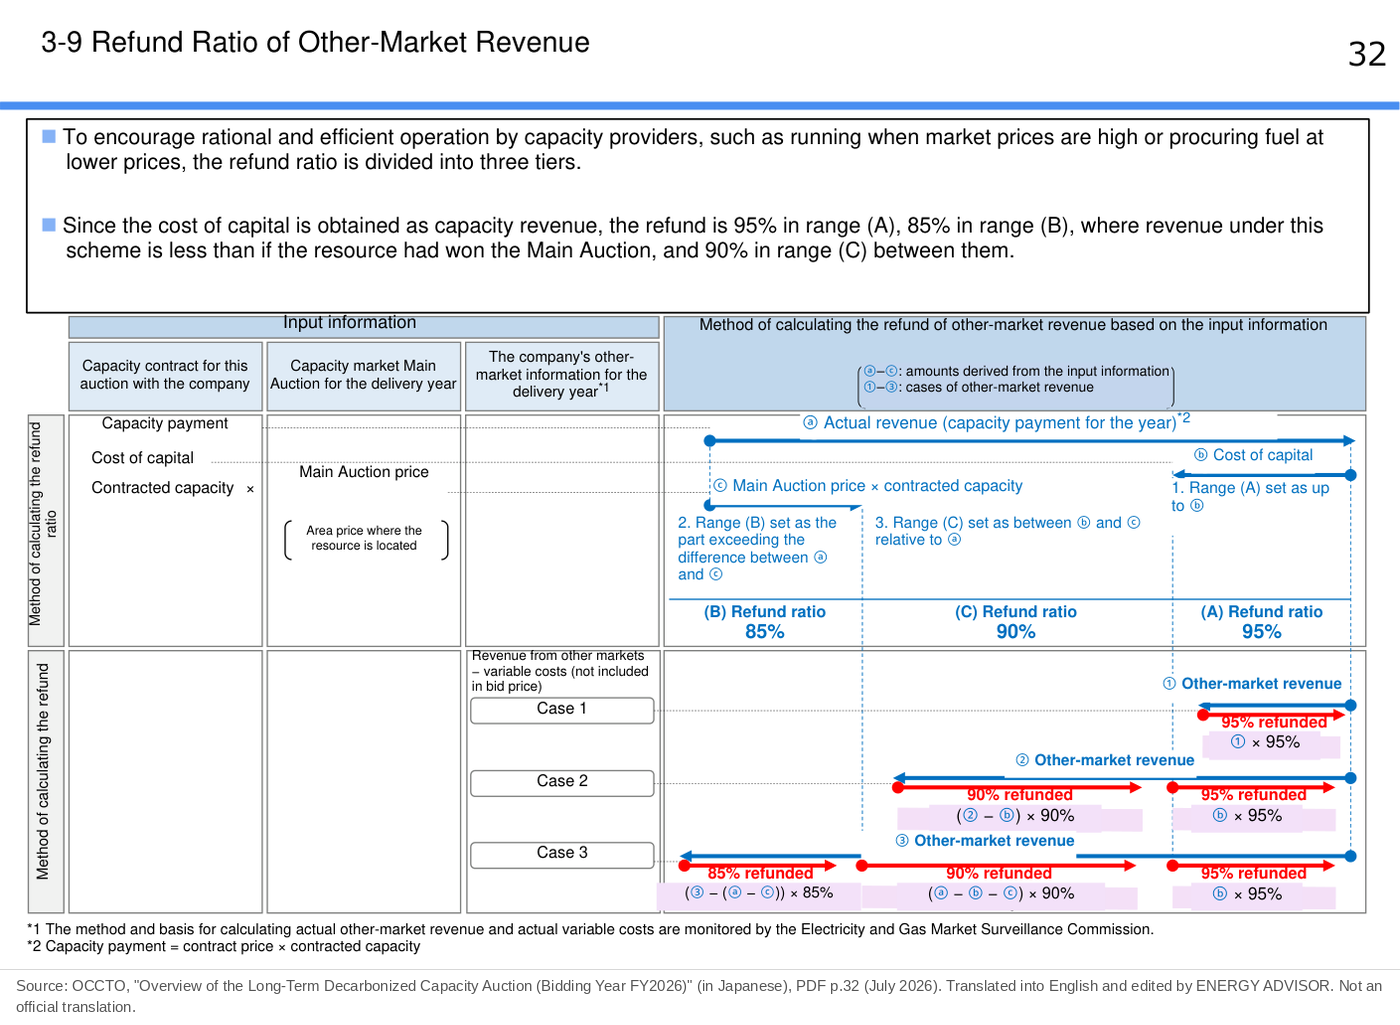
The three-tier refund ratio has existed since the first round (bidding year FY2023). The glossary in the first-round clearing results states that “there are three tiers of refund ratio depending on the amount of other-market revenue” (first-round clearing results, PDF p.9). The second round (PDF p.11) and the third round (73rd meeting, Material 3, PDF p.13) contain the same statement.
The estimated refunds published with the clearing results are calculated for every round with a uniform refund ratio of 90% (73rd meeting, Material 3, PDF p.16).
Fixed refund for LNG-only thermal plants
LNG-only thermal plants choose one of the following refund methods in the fiscal year in which they begin providing supply capacity (Long-Term Decarbonized Capacity Auction Guidelines (Bidding Year FY2026), PDF p.28; overview, PDF p.31).
- Refund based on actual results: refund about 90% of actual other-market revenue
- Fixed refund: refund a set level (¥/kW-year) multiplied by installed capacity. The refund can be fixed for up to 20 years from the start of the support period. The refund method can be chosen again 9 years after the start.
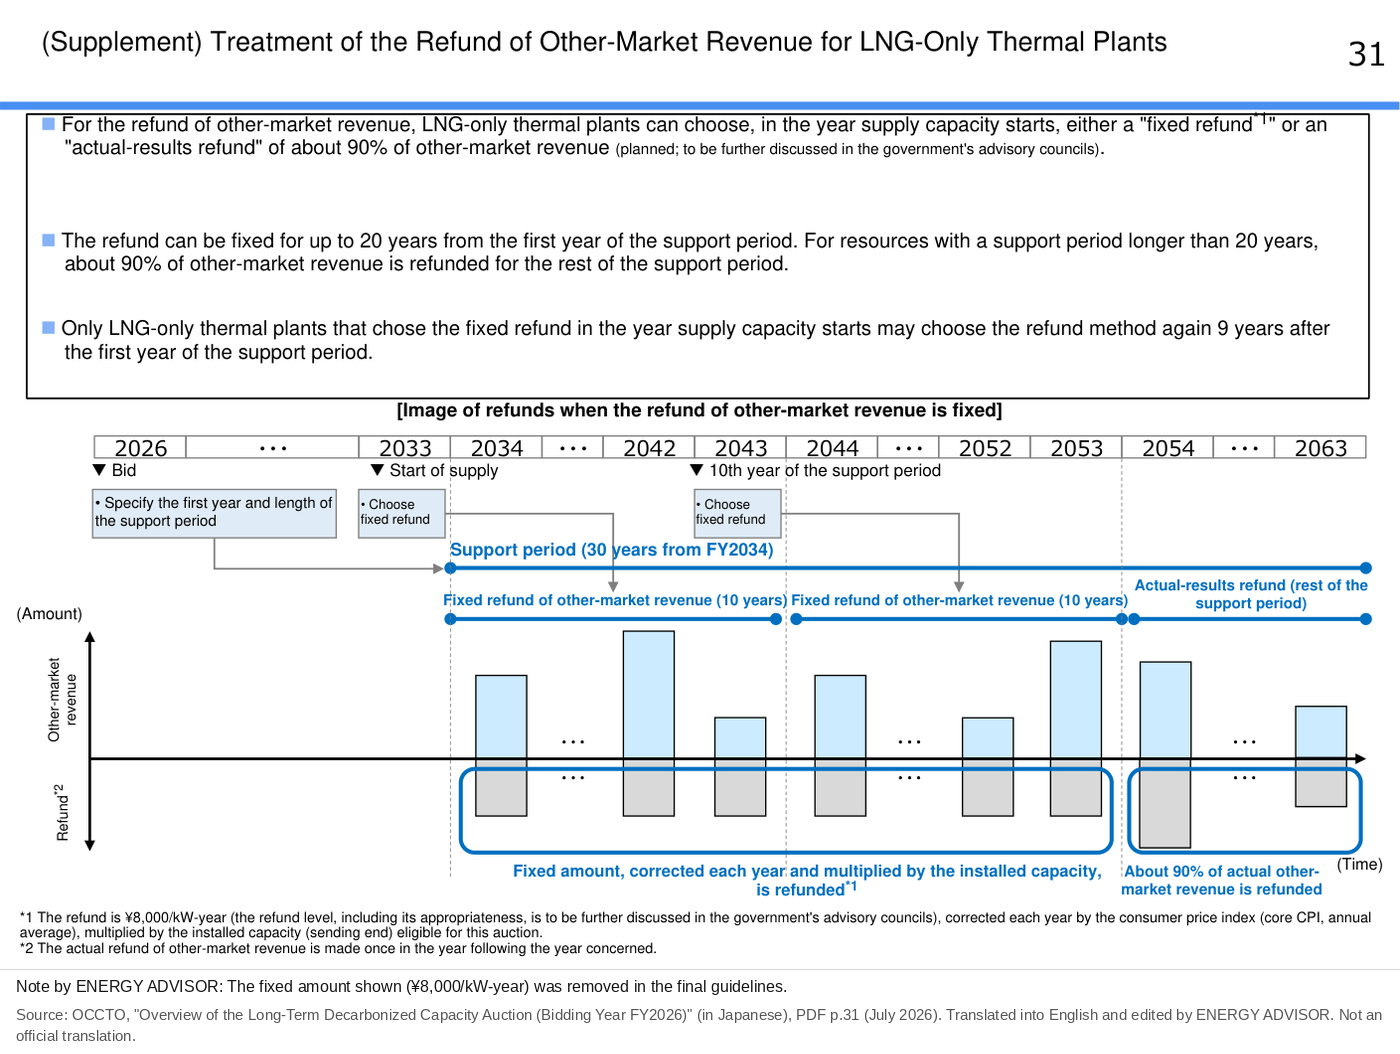
The level of the fixed amount was ¥8,000/kW-year (adjusted each fiscal year by core CPI) in the July overview and in the draft put out for public consultation. The final guidelines of September 2 refer only to the “refund level amount,” and the level and how it is set are still being studied at the government advisory council (Working Group on Stable Power Supply).
Monitoring of other-market revenue
To prevent evasion of refunds, the following monitoring is carried out (ANRE, guideline on the Long-Term Decarbonized Capacity Auction (July 2023)).
- Monitoring of bilateral transactions: where revenue from other markets is earned through bilateral contracts, the EGC checks at the time the contract is concluded (before supply begins) whether the price has been set low to avoid refunds. The contract must be at a price set under trading conditions that do not distinguish between inside and outside the company or group (non-discrimination between internal and external buyers), or at a price not unreasonably low compared with market prices (market price discipline).
- Monitoring of fuel costs: fuel costs are monitored for all projects, to prevent refund evasion such as buying fuel at unreasonably high prices from group companies to inflate variable costs and bring other-market revenue to zero. They are compared with past fuel costs, import prices (the Japan customs-cleared CIF price, which includes freight and insurance at import), fuel market conditions, fuel costs in the Power Generation Cost Verification and fuel costs of other projects. If fuel costs are clearly higher than these, other-market revenue is calculated excluding that portion unless there is a reasonable reason.
Reserve for decommissioning costs of wind and solar
Winning companies for solar and wind (excluding projects tendered under the Act on Promoting the Utilization of Sea Areas for the Development of Marine Renewable Energy Power Generation Facilities) set aside funds with OCCTO for decommissioning and similar costs of their generating facilities, starting 10 years before the end of the support period. This amount is deducted from the capacity payment (overview, PDF p.33).
Estimated Net Burden After Refunds
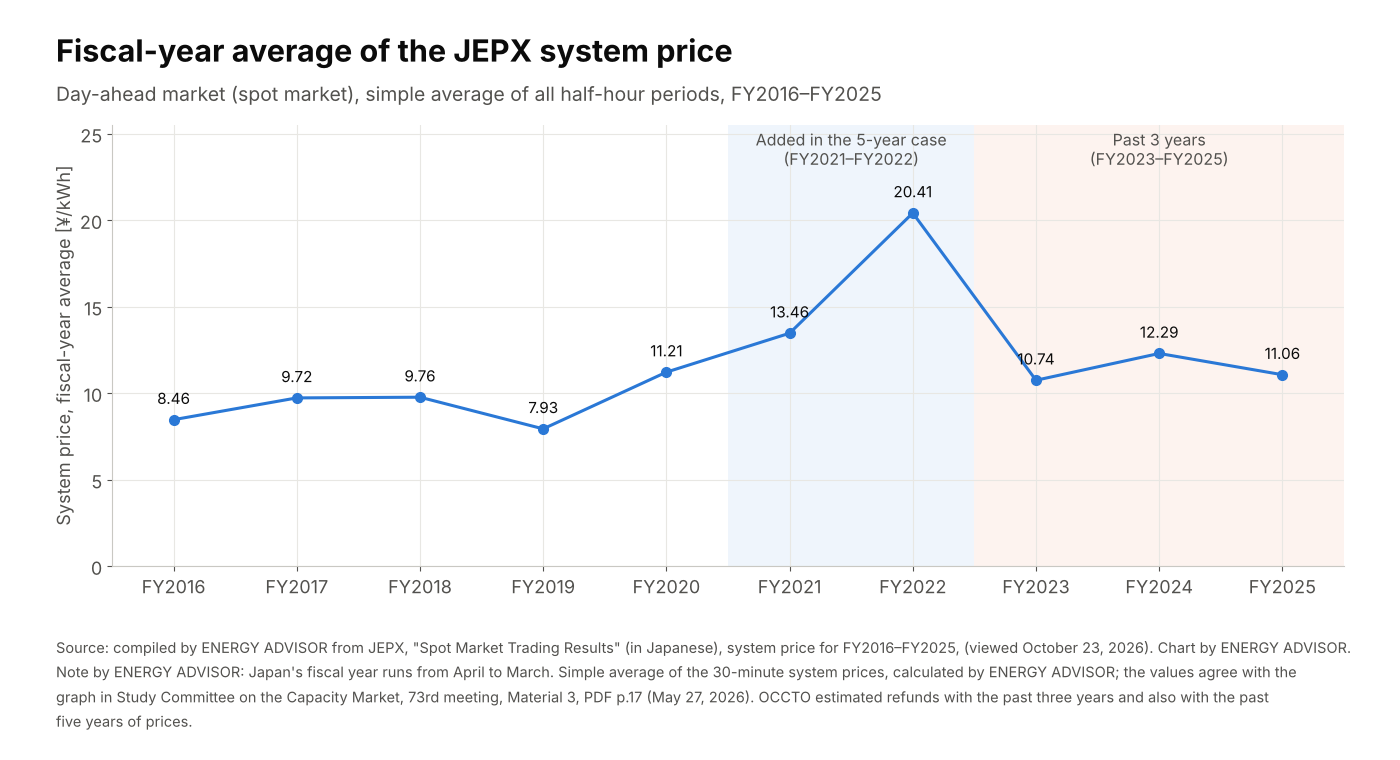
Together with the clearing results, OCCTO publishes, for reference, the total clearing amount after deducting the estimated refund of other-market revenue. The estimated refunds are calculated from prices on the day-ahead market (spot market) and the non-fossil value trading market over the past three or five years, variable costs in the Power Generation Cost Verification and similar data. They differ from the method of calculating, and the amount of, actual refunds. Battery storage, pumped storage and long-duration energy storage are not included in the estimate, because their variable costs and capacity factors are not published.
| Round (bidding year) | Category | Total clearing amount | After deducting estimated refund (past three-year average) | Same (each of the past five fiscal years) |
|---|---|---|---|---|
| 1st (FY2023) | Decarbonized power sources | ¥233.6 billion per year | ¥70.6 billion per year | −¥4.3 billion to ¥156.0 billion per year |
| 1st (FY2023) | LNG-only thermal plants | ¥176.6 billion per year | −¥134.3 billion per year | −¥316.3 billion to ¥106.2 billion per year |
| 2nd (FY2024) | Decarbonized power sources | ¥346.4 billion per year | ¥94.5 billion per year | −¥17.6 billion to ¥162.4 billion per year |
| 2nd (FY2024) | LNG-only thermal plants | ¥45.6 billion per year | −¥5.2 billion per year | −¥49.5 billion to ¥19.5 billion per year |
| 3rd (FY2025) | Decarbonized power sources | ¥474.8 billion per year | ¥342.0 billion per year | ¥209.8 billion to ¥350.3 billion per year |
| 3rd (FY2025) | LNG-only thermal plants | ¥144.4 billion per year | ¥81.0 billion per year | −¥75.4 billion to ¥87.0 billion per year |
(A minus sign indicates that the estimated refund exceeds the capacity payment. Sources: 1st round clearing results, PDF p.10; 2nd round clearing results, PDF p.12; 73rd meeting of the study committee, Material 3, PDF p.14. All estimates assume a refund ratio of 90% (73rd meeting, Material 3, PDF p.16).)
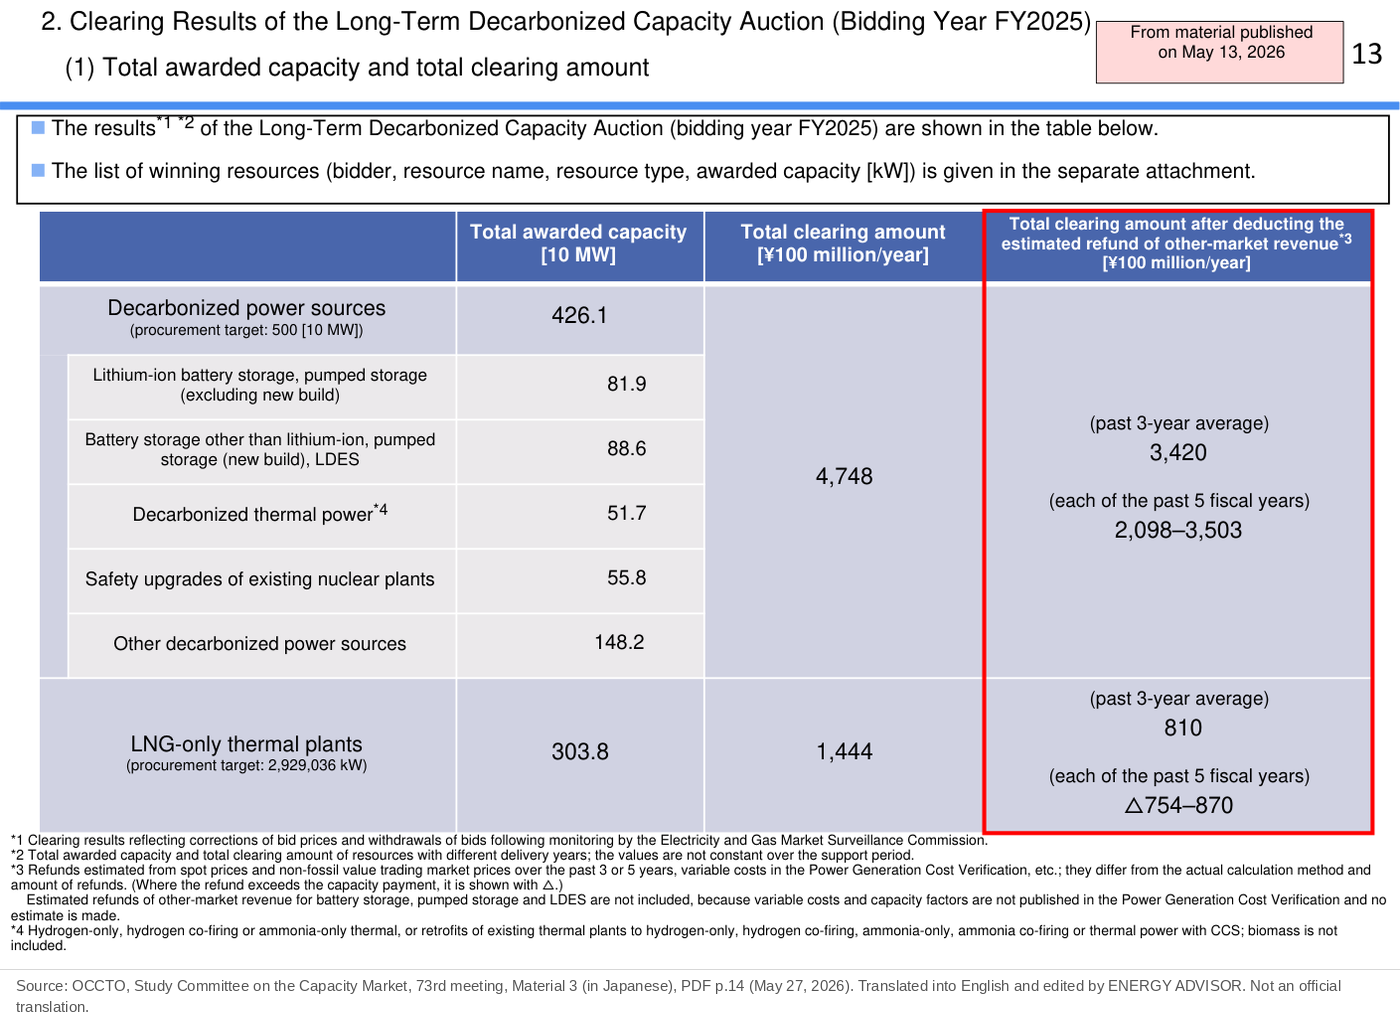
For LNG-only thermal plants in the first and second rounds, the estimated refund exceeded the total clearing amount when past three-year average market prices were assumed. For retail electricity suppliers and others, this estimate effectively means a payback. For the third round, the estimate leaves a burden of ¥81.0 billion per year under the past three-year average assumption. Note that the results change greatly depending on which years’ market prices are assumed, and the range of estimates is wide.
Summary
- Bid prices may include capital costs, O&M costs and the cost of capital, and are calculated with other-market revenue set at ¥0. In FY2026, the WACC for the cost of capital became 4.5%, 5.5% or 6.5% depending on the commissioning deadline.
- Price caps are set for each resource type based on the Power Generation Cost Verification. In FY2026, they were raised to 2 times the cost parameters for some resources, and for LNG-only thermal plants they were split depending on whether an LNG terminal must be developed.
- The EGC monitors bid prices; if costs are disallowed, the bid is revised or withdrawn.
- The average winning price in the first round was ¥58,000/kW-year for decarbonized power sources and ¥30,000/kW-year for LNG-only thermal plants. The total clearing amount for decarbonized power sources in the third round was ¥474.8 billion per year.
- Companies refund about 90% of other-market revenue (in three tiers of 85%, 90% and 95%). In estimates after deducting the estimated refund, LNG-only thermal plants in the first and second rounds can effectively result in a payback, but the results vary greatly with the assumptions.
This article is based on published materials from the Ministry of Economy, Trade and Industry and its Agency for Natural Resources and Energy, the Electricity and Gas Market Surveillance Commission, the Organization for Cross-regional Coordination of Transmission Operators (OCCTO) and other sources. The English translations of figures are by ENERGY ADVISOR and are not official translations. When using this information for decisions, please check the original sources. When we find an error, we correct the article and note the date of the correction.
Sources
- OCCTO, “Overview of the Long-Term Decarbonized Capacity Auction (Bidding Year FY2026)” (in Japanese), PDF p.25, pp.30–33, pp.43–44, July 2026. https://www.occto.or.jp/assets/various/capacity-market/youryou_setsumeikai/202607_youryou_gaiyousetsumei_long-r.pdf
- OCCTO, “Capacity Market Long-Term Decarbonized Capacity Auction Guidelines (Bidding Year FY2026)” (in Japanese), PDF p.9, pp.18–19, p.28, p.34, September 2, 2026. https://www.occto.or.jp/assets/260902_boshuyoukou_long_2026.pdf
- Same guidelines, draft (in Japanese) (public consultation period July 21–August 3, 2026). https://www.occto.or.jp/assets/2026_tyouki_bosyuyoko.pdf
- Advisory Committee for Natural Resources and Energy, Subcommittee on Electricity and Gas Basic Policy, Working Group on Market Design, 92nd meeting, Material 3-3, “About the Long-Term Decarbonized Capacity Auction” (ANRE) (in Japanese), PDF pp.5–7, May 10, 2024. https://www.meti.go.jp/shingikai/enecho/denryoku_gas/denryoku_gas/seido_kento/pdf/092_03_03.pdf
- OCCTO, “Capacity Market Long-Term Decarbonized Capacity Auction Clearing Results (Bidding Year FY2023)” (in Japanese), PDF p.9 (three-tier refund ratio), p.10, April 26, 2024. https://www.occto.or.jp/assets/market-board/market/oshirase/2024/files/240426_longauction_youryouyakujokekka_kouhyou_ousatsu2023.pdf
- OCCTO, “Capacity Market Long-Term Decarbonized Capacity Auction Clearing Results (Bidding Year FY2024)” (Board of Directors, 509th meeting, Agenda Item 5) (in Japanese), PDF pp.11–12, April 28, 2025. https://www.occto.or.jp/assets/soukaihoka/rijikai/2025/files/rijikai_509_gian5.pdf
- Study Committee on the Capacity Market, 73rd meeting, Material 3, “Long-Term Decarbonized Capacity Auction Clearing Results (Bidding Year FY2025) and Toward the Next Auction” (in Japanese), PDF pp.13–14, p.16, May 27, 2026. https://www.occto.or.jp/assets/iinkai/youryou_kentoukai/73/youryou_kentoukai_73_03.pdf
- Working Group on Market Design, 8th Interim Report (in Japanese), October 2022. https://www.meti.go.jp/shingikai/enecho/denryoku_gas/denryoku_gas/seido_kento/pdf/20221003_1.pdf
- ANRE, guideline on the Long-Term Decarbonized Capacity Auction (in Japanese), July 2023. https://www.enecho.meti.go.jp/category/electricity_and_gas/electric/summary/regulations/pdf/choukigl_20230711.pdf
- EGC, “Monitoring of the Long-Term Decarbonized Capacity Auction (Bidding Year FY2023)” (in Japanese), September 2023. https://www.occto.or.jp/assets/market-board/market/files/20230921_kanshitouiinkai.pdf
- OCCTO, “Details of the Long-Term Decarbonized Capacity Auction (Bidding Year FY2023)” (in Japanese), September 2023 (source of figures in the original article). https://www.occto.or.jp/assets/market-board/market/files/202309_youryou_syousaisetsumei_long.pdf
- Long-Term Decarbonized Capacity Auction Guidelines (Bidding Year FY2024) (OCCTO Board of Directors, 474th meeting, Agenda Item 4) (in Japanese), PDF pp.17–18 (price caps), September 4, 2024. https://www.occto.or.jp/soukaihoka/rijikai/2024/files/rijikai_474_gian4.pdf
- Long-Term Decarbonized Capacity Auction Guidelines (Bidding Year FY2025) (OCCTO Board of Directors, 528th meeting, Agenda Item 2) (in Japanese), PDF pp.18–19 (price caps), September 3, 2025. https://www.occto.or.jp/soukaihoka/rijikai/2025/files/rijikai_528_gian2.pdf
- EGC, “Monitoring of the Long-Term Decarbonized Capacity Auction (Bidding Year FY2023)” (briefing material) (in Japanese), PDF p.5, pp.10–11, September 21, 2023 (source of figures in the original article). https://www.occto.or.jp/assets/market-board/market/files/20230921_kanshitouiinkai.pdf
- OCCTO, “Details of the Long-Term Decarbonized Capacity Auction (Bidding Year FY2023)” (briefing material) (in Japanese), PDF p.23, p.42, p.78, September 2023 (source of figures in the original article). https://www.occto.or.jp/assets/market-board/market/files/202309_youryou_syousaisetsumei_long.pdf