When comparing high-voltage electricity prices, there are times when you try to estimate future electricity charges based on terms offered by several electricity suppliers. It is easy to overlook that the reliability of the comparison changes greatly with the method of estimation. This article carefully sets out the approach of “applying past actual usage” in comparing electricity charges, together with an example calculation using actual published unit prices.
Key points
- 1To estimate future electricity charges, you have to set everything as assumed values: not only your own figures, such as monthly electricity consumption and the share of use by time period, but also the large variable factors, such as fuel prices and prices in the JEPX day-ahead market (spot market).
- 2Of these, fuel prices and market prices depend on world events, weather and supply and demand, so the assumptions are likely to be wrong. In practice, it is quite difficult to foresee an accurate amount through forward-looking simulation.
- 3It is not a solution in itself, but as one guide there is a method of applying each company’s rate structure to past actual results (fixed usage and fixed unit prices) and calculating “how much it would have been in that period.”
- 4Market prices tend to rise in summer and winter, when demand is high, and these tend to coincide with the seasons and hours when customers themselves use a lot of electricity. The strength of back-testing is that it can accurately reflect even this overlap: “how much you were using when the market was high.”
- 5Even for the same factory with the same usage pattern, putting past January fuel and market prices into the three current plans you can contract now (Basic, Zero Market Adjustment and Market-Linked) changes the bill greatly. In January 2021, when the market surged, the Market-Linked Plan was the most expensive (about ¥7.28 million per month in the estimate). In January 2023, when fuel surged, the Zero Market Adjustment Plan was instead the most expensive. The favorable plan switched depending on that year’s conditions.
- 6This back-testing can be used in the same way for other companies’ plans, such as those of new entrant retailers, and it is worth checking plans under consideration with each month’s fixed values even after signing a contract.
- 7Back-testing against actual results is also only a check of past trends and does not guarantee future electricity charges.
Part 1 looked at why high-voltage and extra-high-voltage electricity prices are hard to compare, and Part 9 explained five points for checking quotations. This part explains, as the core idea this series aims to convey, the difference between a simulation that estimates by assuming future conditions and the method of applying past actual results.
Forward-Looking Simulation and Why It Rarely Hits the Mark
A forward-looking simulation is a method of estimating how much future electricity charges will be by setting assumed conditions. In quotations, it is often presented in the form “In your case, it will be about this much per year,” which at first glance seems easy to understand.
However, this estimate needs two layers of assumptions to work.
The first is assumptions on your own side (the demand side). You need to set monthly electricity consumption and the share of use by time period as assumed values. Because usage changes every year with production volume, operating days and temperature, a certain range of uncertainty already arises at this point.
The second, more serious one is assumptions on the rate side (the variable factors). As seen in Parts 3 and 6, in current high-voltage electricity charges, the fuel cost adjustment and the market price adjustment (or the market price itself in a market-linked plan) are variable factors that move the monthly amount greatly. Fuel prices are determined by world events and other factors at each point in time, and JEPX spot market prices change daily with weather and supply and demand. In a forward-looking simulation, the calculation does not work unless even these “values no one can predict in the first place” are set as assumed values. And these assumptions about the variable factors are the part most likely to be wrong.
Because the error in the demand-side assumptions and the error in the variable-factor assumptions combine to affect the result, in practice it is quite difficult to foresee the “correct amount” through forward-looking simulation.
In an estimate of “about this much per year,” what fuel and market prices are assumed behind the figure is the part that moves the most. When you receive an estimate, you need to check those assumed values.
Not a Solution, but a Guide: “Applying Past Actual Results”
There is therefore a method that, while not a solution in itself, serves as a guide: applying past actual results.
This means applying each company’s unit prices that you want to compare to the electricity your company actually used and its data by time period (fixed actual values), and recalculating “how much that period would have cost under this contract.” The important point is that, for past periods, not only your own usage but also the variable factors, such as the fuel cost adjustment rate, market prices and the renewable energy surcharge, are all published as fixed values. In other words, the factors described above as “unpredictable” in forward-looking simulation can be used in the calculation without any assumptions.
It is not a method for predicting the future. Even so, the figure “had we been on this contract, the past would have looked like this” can be checked as something close to a fact rather than a forecast. This is the decisive difference from an estimate built up from assumed values.
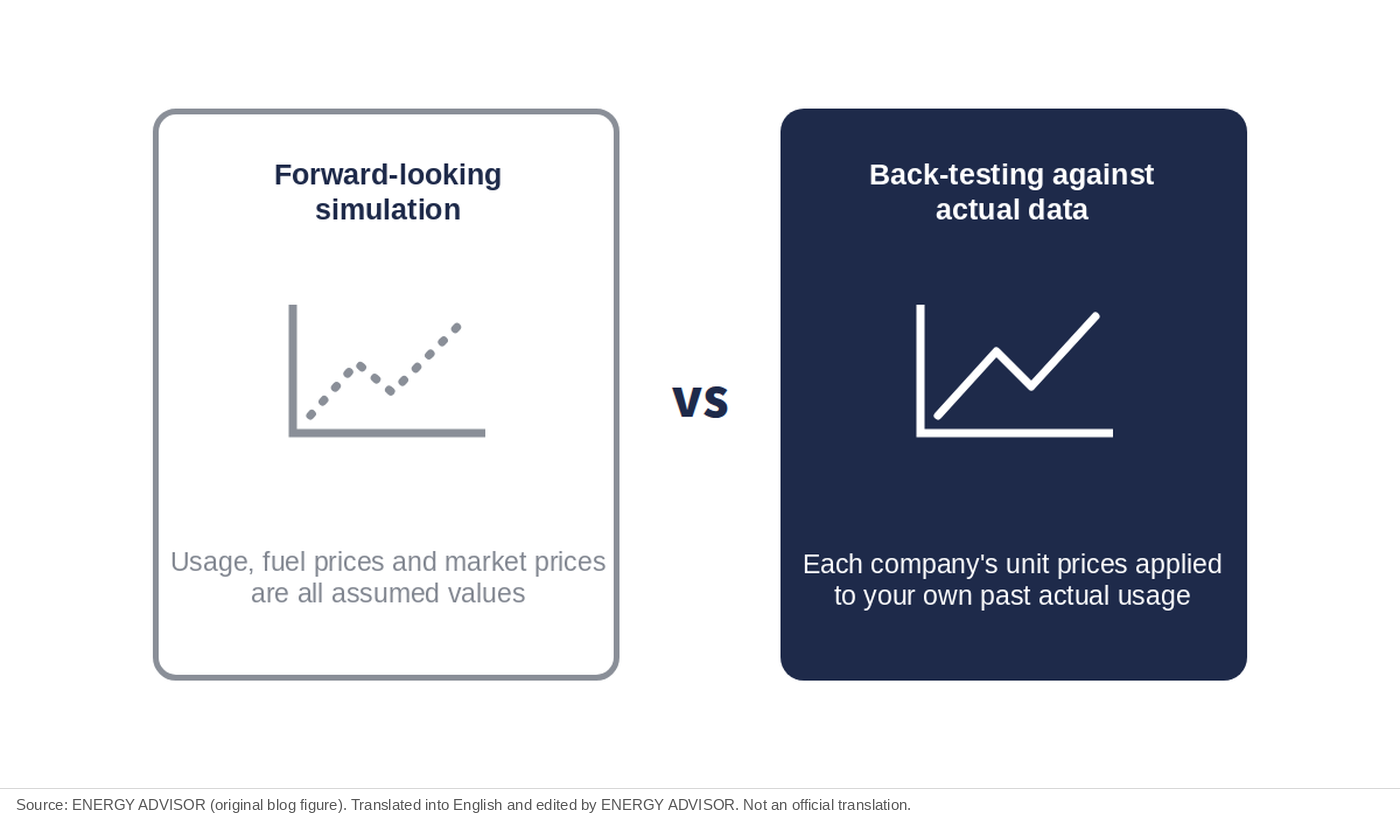
The idea of using actual data is not itself special. In comparing high-voltage electricity prices, however, the work of applying the data is cumbersome, so it is often replaced by a simplified estimate based on average values.
The Strength of Back-Testing: The Overlap Between “When the Market Is High” and “When You Use a Lot”
Applying past actual results has a strength that goes a step beyond simply “being able to calculate with fixed values.”
First, fuel prices. Because fuel prices are determined by world events and other factors at each point in time, they are hard to predict in advance, but which fuel cost adjustment rate was applied in each past month is published and fixed.
Next, market prices. JEPX spot market prices tend to rise in summer and winter, when electricity demand is high. And for many customers, summer and winter are also when their own usage rises because of air conditioning and other loads. In other words, “the seasons and hours when market prices tend to be high” and “the seasons and hours when your company uses a lot of electricity” tend to overlap.
In contracts that reflect market prices, this overlap directly affects the amount. Because the burden is set by how much you used in the 30-minute periods (trading periods of 30 minutes) when the market was high, even with the same monthly usage, the bill grows larger for customers that use more in high-priced hours. A simple estimate that multiplies average usage by an average market price loses this “overlap effect.” On the other hand, back-testing that calculates by matching usage in each 30-minute period with the market price actually set at that time can reproduce even this effect accurately.
Estimate Putting Three Past Januarys into the Three Current Plans: Same Inputs, Different Results Depending on Plan Design
Let us check the approach of “applying past actual results” seen so far, using actual published past figures. The method used here is to put the fixed values of fuel prices and market prices actually recorded in a past month into the calculation formulas of the current plans you can contract now. By preparing the calculation formulas of the plans you want to compare as they are and entering past fixed values in them, you can see side by side, for each plan, “how much it would have cost if we had used this plan under that month’s conditions.”
The key to the comparison is to fix the customer’s usage pattern to one and change only the year, in the same month. Different months mean different usage and temperatures, so the comparison is aligned on January. Here, one high-voltage customer like the following is assumed (purely as hypothetical settings for an example calculation).
- Type of business: a factory, such as food processing, with equipment operating mainly from about 8:00 to 18:00 on weekdays
- Contract demand: 250 kW
- Electricity consumption in January: 80,000 kWh
- Load factor: about 43% (average power in January of about 108 kW ÷ contract demand of 250 kW. The load factor is the ratio showing how much electricity is used on average relative to contract demand.)
- Power factor: 85% (assumed to bring no discount or surcharge on the demand charge. The power factor is the share of the electricity delivered that actually does work.)
Since FY2024 (Japan’s fiscal year runs from April to March), TEPCO Energy Partner’s high-voltage standard tariff has been divided into three plans: the “Basic Plan,” the “Zero Market Adjustment Plan” and the “Market-Linked Plan” (as each mechanism was confirmed in Part 4). As the names suggest, the three differ in design in how much of the changes in fuel prices and market prices they reflect in the charges. The unit prices and design effective April 1, 2026 (Kanto area, high-voltage) are as follows.
| Item (tax included) | Basic Plan | Zero Market Adjustment Plan | Market-Linked Plan |
|---|---|---|---|
| Demand charge | ¥2,530.00/kW | ¥2,720.00/kW | ¥1,500.00/kW |
| Energy charge | ¥17.43/kWh | ¥17.21/kWh | Morning, daytime and evening ¥15.18, night ¥15.00/kWh |
| Fuel cost adjustment | Yes | Yes (largest reflection) | No |
| Market price adjustment | Partly reflected | No | Fully reflected |
Source: TEPCO Energy Partner, “FY2026 Electricity Rate Table (Extra-High-Voltage and High-Voltage)” (in Japanese)
(From November 1, 2026, to reflect the revision of network charges, the demand charge changes to ¥2,651.50 for the Basic Plan, ¥2,846.50 for the Zero Market Adjustment Plan and ¥1,608.57/kW for the Market-Linked Plan, and the energy charge to ¥17.47 for the Basic Plan and ¥17.26/kWh for the Zero Market Adjustment Plan. The energy charge of the Market-Linked Plan does not change. See Part 4.)
The size of the fuel cost adjustment’s reflection can be compared by how much the fuel cost adjustment rate moves when the average fuel price moves by ¥1,000/kL (the reference fuel unit rate). For Kanto, high-voltage, it is ¥0.144 for the Basic Plan and ¥0.263 for the Zero Market Adjustment Plan, so the Zero Market Adjustment Plan reflects it more strongly. The reference fuel price is ¥35,600/kL for both.
Source: TEPCO Energy Partner, “FY2026 Electricity Rate Table (Extra-High-Voltage and High-Voltage)” (in Japanese), p.7 (calculation parameters effective April 1, 2026)
Here is the difference in design in a few words each. The Basic Plan has both a fuel cost adjustment and a market price adjustment, but it is designed to reflect only part of the market price. The Zero Market Adjustment Plan has no market price adjustment at all; in exchange, its demand charge is somewhat higher and its fuel cost adjustment has the largest effect of the three. The Market-Linked Plan has no fuel cost adjustment, and its energy charge is set lower accordingly, but it reflects the JEPX spot market price as it is (as its mechanism was confirmed in Part 5). Thus, the design means that which plan is favorable changes between years when fuel prices move and years when market prices move.
Next are the past input values to put into these three plans. For the three Januarys compared here (2021, 2023 and 2025), the average fuel price for the month (the value on which the fuel cost adjustment is based) and the JEPX Tokyo area spot market price are listed below.
| Input values (actual results for each January) | January 2021 | January 2023 | January 2025 |
|---|---|---|---|
| Average fuel price | ¥21,800/kL | ¥100,200/kL | ¥50,200/kL |
| JEPX market price (monthly average, Tokyo area) | About ¥66/kWh | About ¥20/kWh | About ¥14/kWh |
| Of which, evening (16:00–22:00) average | About ¥107/kWh | About ¥24/kWh | About ¥16/kWh |
Source: Average fuel prices from TEPCO Energy Partner, “Notice of Fuel Cost Adjustment and Other Rates” for January 2021, January 2023 and January 2025 (in Japanese); market prices calculated as monthly averages of the Tokyo area price in JEPX, “Spot Market Trading Results”
The three sets of input values differ in character. January 2021 was a month when fuel prices were low but market prices were exceptionally high. January 2023 was the opposite: fuel prices were very high, and market prices were calm. In January 2025, both fuel and the market were relatively calm.
Applying these input values to this factory (contract demand 250 kW, 80,000 kWh in January) with the calculation formulas of the three current plans gives the following monthly bill totals.
| Monthly total (estimate) | January 2021 | January 2023 | January 2025 |
|---|---|---|---|
| Basic Plan | About ¥4.43 million | About ¥3.43 million | About ¥2.61 million |
| Zero Market Adjustment Plan | About ¥2.10 million | About ¥3.75 million | About ¥2.70 million |
| Market-Linked Plan | About ¥7.28 million | About ¥2.70 million | About ¥2.12 million |
*Assumptions of this estimate: The demand charge, energy charge, calculation formulas and reference values of the fuel cost adjustment and market price adjustment, and the renewable energy surcharge (common to the three plans, ¥4.18/kWh for FY2026) all use the values effective April 1, 2026 (Kanto, high-voltage). Only the average fuel price and the JEPX market price (monthly averages for each time period in the Tokyo area) for each month were entered as past values. The market price adjustment was calculated by multiplying the difference between the monthly average Tokyo area price for each time period (morning, daytime, evening, night) and the reference market price (¥11.60) by the reference market unit rate for December to February (¥0.474 for the Basic Plan, ¥1.142 for the Market-Linked Plan; rate table p.8), and weighting by the share of use in each time period (calculated from JEPX’s published spot market data; averages by time period for January 2021: morning about ¥71, daytime about ¥59, evening about ¥107, night about ¥53). The share of use by time period was set at about 31% morning, about 19% daytime, about 19% evening and about 31% night, assuming a factory that operates during weekday daytime (time periods: morning 8:00–13:00, daytime 13:00–16:00, evening 16:00–22:00, all on weekdays including Saturdays; night means all other hours plus all day on Sundays, national holidays and similar days). In actual charges, fuel prices and market prices are reflected with a lag of about one to two months, but here this is simplified to “if that month’s price level were reflected as it is.” Power factor 85% (no discount or surcharge). Government burden-reduction measures and the amount corresponding to the capacity contribution (Part 7) are not included. The figures differ from actual bills.
Converting the same results into unit prices per kWh and showing them in a graph makes the difference in the character of the plans easier to see.
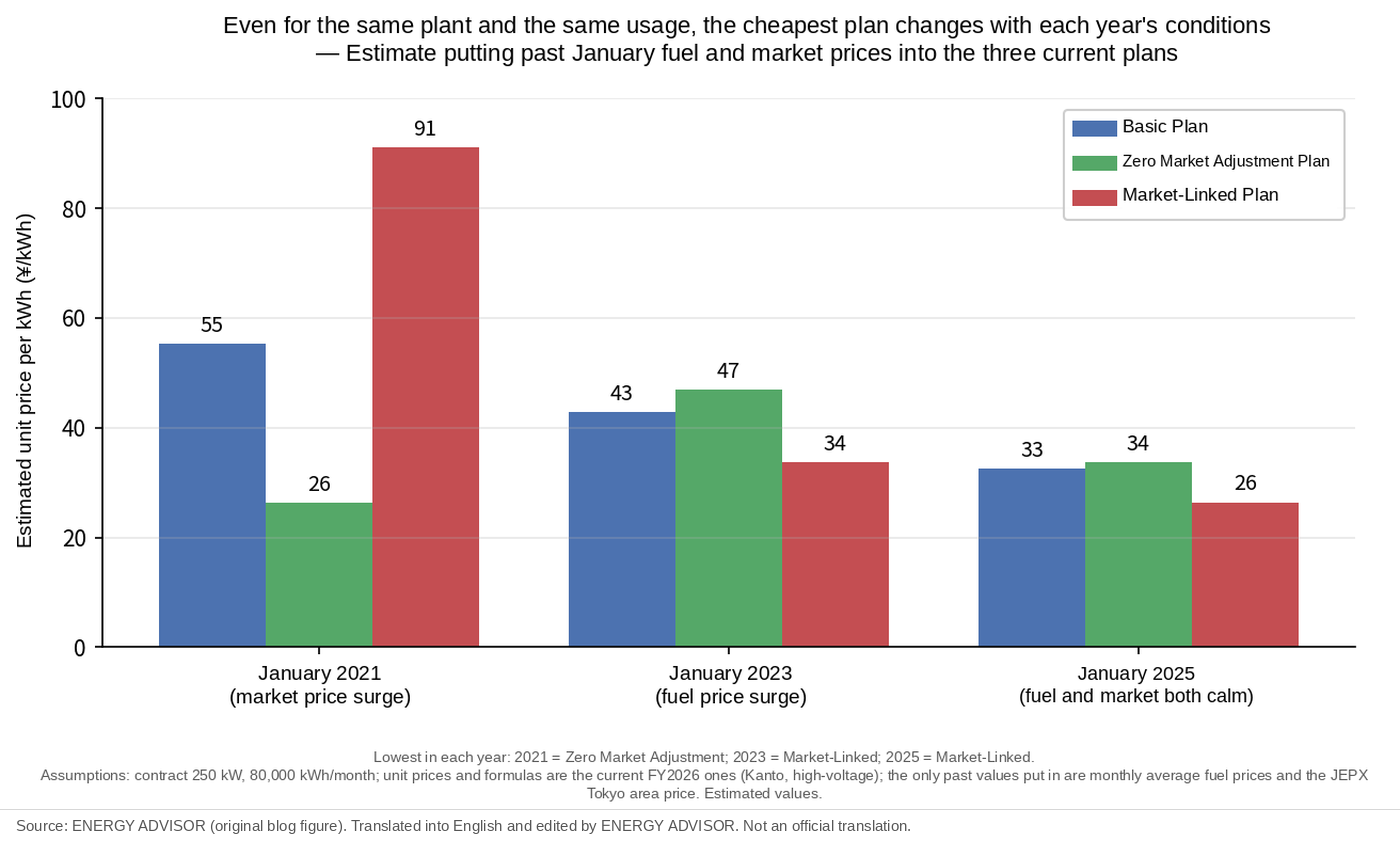
The assumption is that the same factory used the same amount of electricity in the same way. Even so, the results in the table and graph change greatly by plan and by year.
Looking down the January 2021 column (the month when market prices surged), the Market-Linked Plan stands out at about ¥7.28 million. Per kWh, that is about ¥91, more than three times the level in a calm year (January 2025). Because the plan is designed to reflect market prices as they are, that surge shows up directly in the charges. In particular, because this factory operates during weekday daytime, its use is concentrated in the daytime periods (morning, daytime and evening), when market prices tend to be high. In that year, the evening average was especially high, at about ¥107. For this factory, with its use concentrated in the daytime, this means it used a lot of electricity in periods priced higher than the monthly average (about ¥66), and its burden grew accordingly. The Zero Market Adjustment Plan, on the other hand, was the lowest of the three at about ¥2.10 million. This is because, in addition to its design not reflecting market prices, the fuel price that month was below the reference, so the fuel cost adjustment worked as a negative. The Basic Plan, designed to reflect only part of the market price, came in between the two.
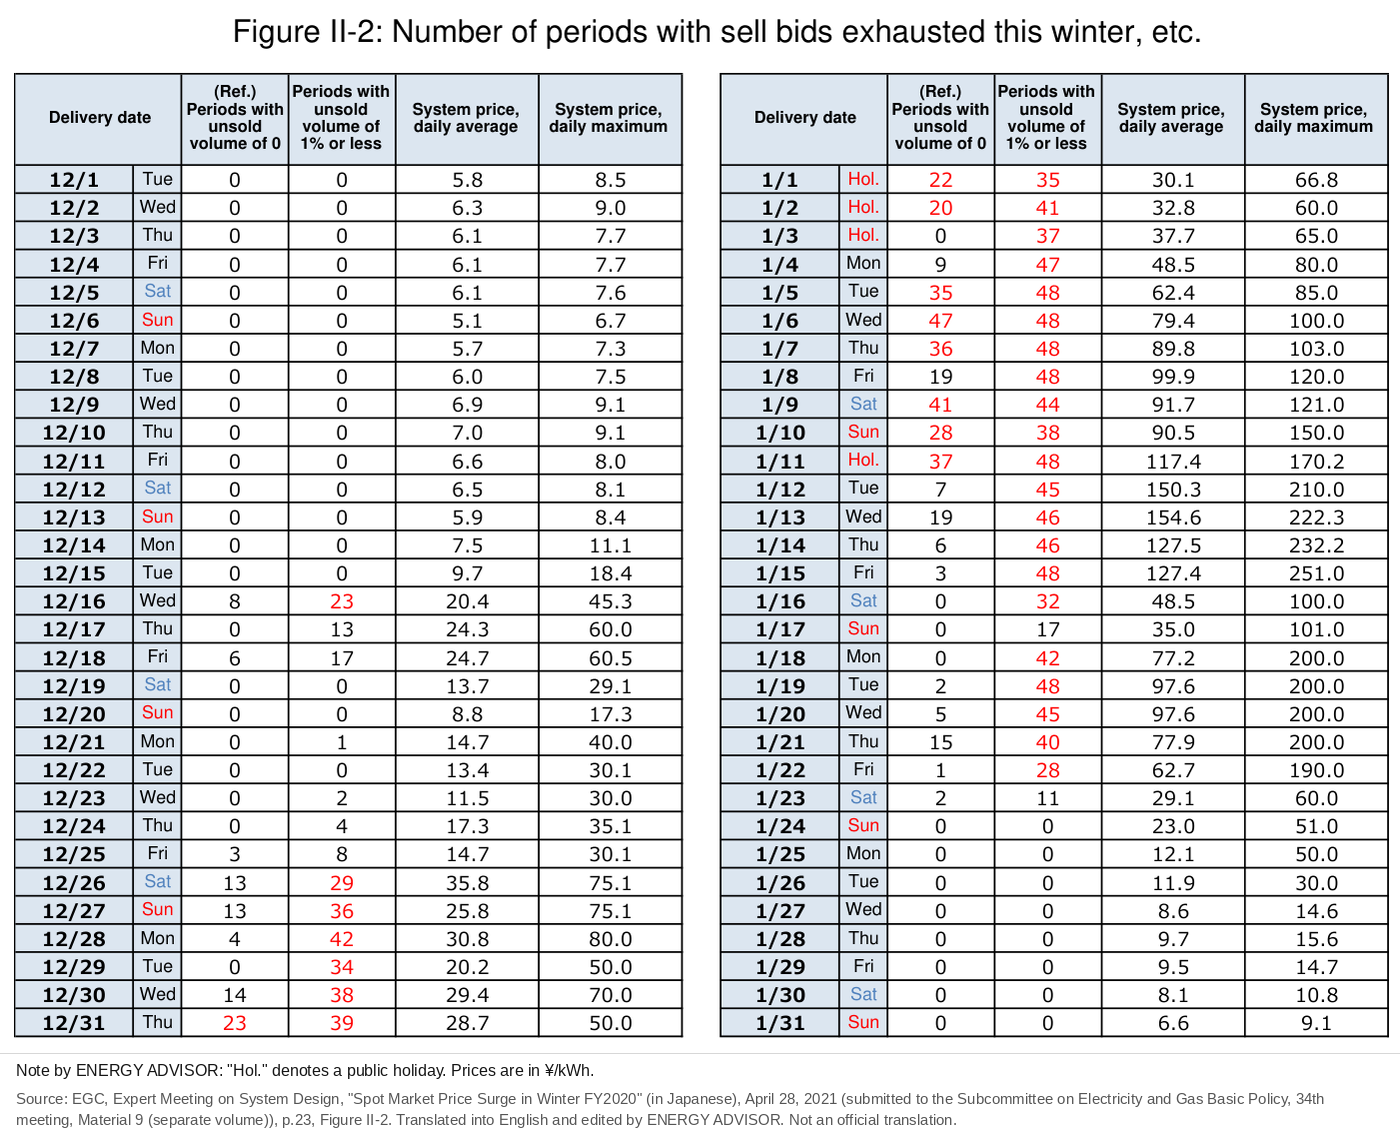
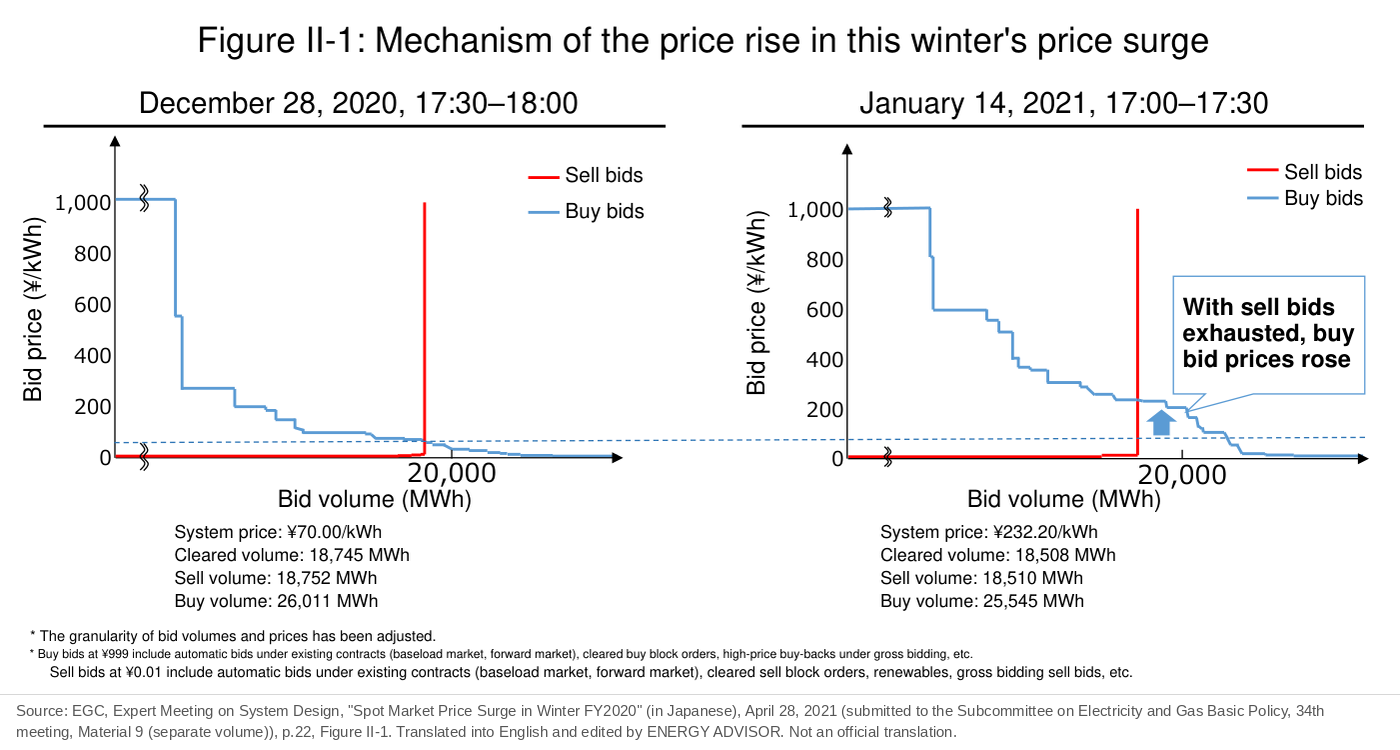
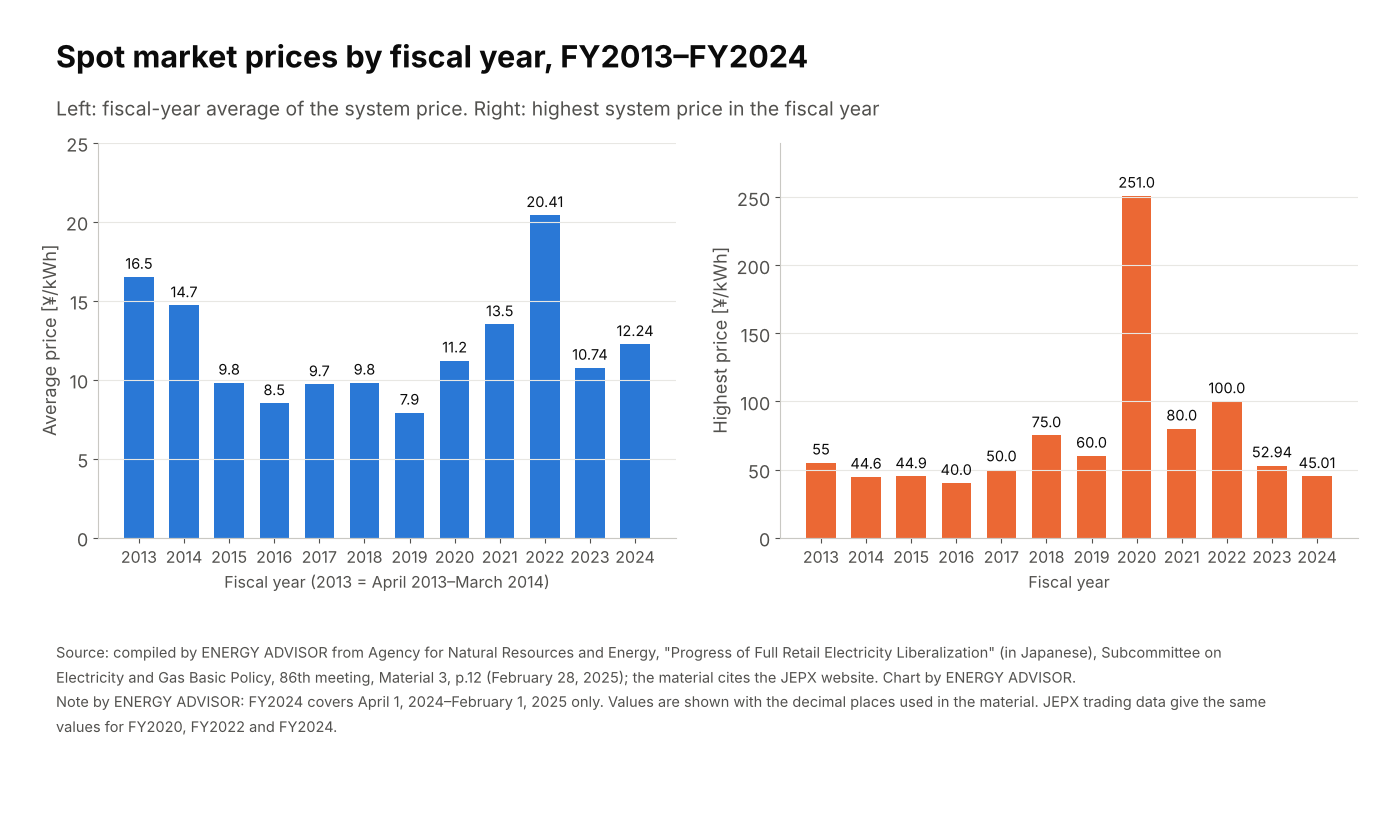
How much market prices actually surged is also on the public record. In the JEPX spot market in January 2021, the daily average system price (the reference price set by pooling supply and demand nationwide) was highest at ¥154.57/kWh on January 13, and a record high of ¥251.00 per kWh was recorded in a single 30-minute period, 16:30–17:00 on January 15. Plans that reflect market prices as they are pass such surges directly into the charges.
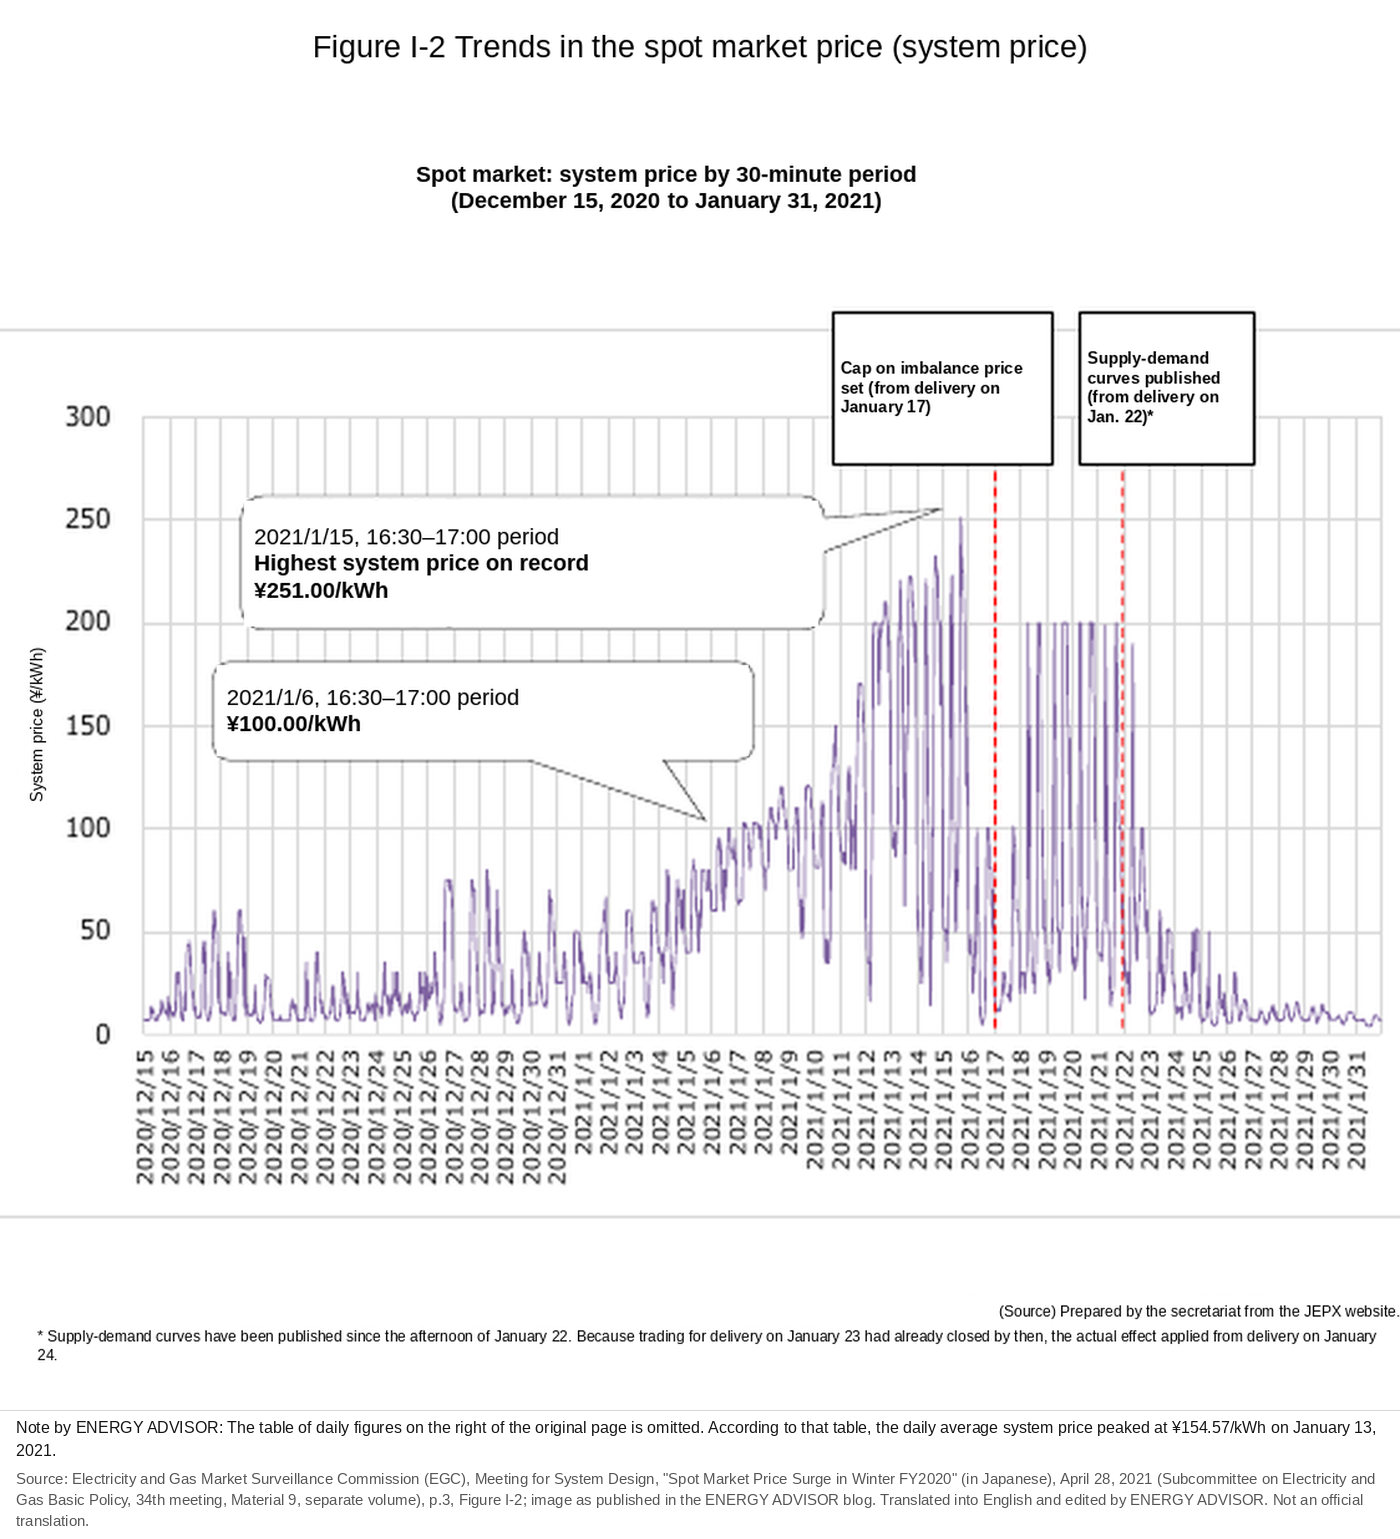
Source: Electricity and Gas Market Surveillance Commission (EGC), Meeting for System Design, “Spot Market Price Surge in Winter FY2020” (in Japanese), April 28, 2021 (Subcommittee on Electricity and Gas Basic Policy, 34th meeting, Material 9, separate volume), p.3, “Figure I-2: Trends in the spot market price (system price)”
Looking at January 2023 (the month when fuel prices surged), the order is reversed. The Zero Market Adjustment Plan was the most expensive at about ¥3.75 million. This is because market prices were calm, but fuel prices were very high, and the burden concentrated on this plan, which has the largest reflection of the fuel cost adjustment. Conversely, the Market-Linked Plan, which has no fuel cost adjustment, was the lowest that year at about ¥2.70 million. Compared with January 2021, the favorable and unfavorable plans are exactly reversed.
In January 2025 (a month when both fuel and the market were calm), the differences among the three plans became small, and of them the Market-Linked Plan was somewhat lower at about ¥2.12 million. In a period when the variable factors are quiet, the market-linked plan, with its energy charge set lower, looks favorable on paper.
Even with the same input values, the Market-Linked Plan was the most expensive in January 2021 and the Zero Market Adjustment Plan in January 2023; favorable and unfavorable switch with each year’s conditions. The table shows that the question “which plan is cheaper?” contains the premise “in which year, and under what conditions?”
What matters here is not which plan is better. Each plan simply absorbs different variable factors. The Market-Linked Plan swings widely in years when the market is turbulent, and the Zero Market Adjustment Plan swings widely in years when fuel is expensive. The way to use this method is to fix your own usage pattern, put in several past conditions, and check how each plan swings.
Applying It to Other Companies’ Plans, Including New Entrant Retailers
So far this has been explained with TEPCO Energy Partner’s three plans, but this back-testing approach is not limited to a particular company’s menu. For plans offered by other companies, including new entrant retailers, putting the same past input values into that company’s calculation formulas (demand charge, energy charge, fuel cost adjustment, its own market price adjustment and so on) allows comparison on the same basis.
Each company’s plans differ in the level of the demand charge, the coefficients of the fuel cost adjustment, and how market prices are reflected. Looking only at the rate table offered under normal conditions, it is hard to see how those differences affect the amount. However, putting in the fixed values of past months when prices surged and months when they were calm lines up the character of each plan in the form of amounts: “is this company’s plan weak in years when fuel moves, or in years when the market moves?” Against the difficulty of high-voltage quotations, where each company’s terms differ and comparison is hard (as confirmed in Part 9), this method provides a common basis for comparison.
Even when quotations are lined up side by side, if each company writes its unit prices differently, it is hard to tell which is favorable. Using “the same past conditions” as a common input allows the character of each plan to be compared on the same basis.
Checking After Signing: “How Much Would That Plan Have Cost This Month?”
Finally, this method is not only for before deciding on a contract.
After signing a contract, and also for plans you did not sign but kept as candidates, calculating “how much this month would have cost on that plan” each time the month’s market prices and fuel prices are fixed reveals several things. How did the plan you are on compare with other plans under that month’s conditions? Is the plan you passed on moving as you expected? Continuing such checks lets you decide, the next time you review your contract terms, based on accumulated actual figures.
Because high-voltage electricity charges change every month with factors your company cannot control, namely fuel prices and market prices, it is effective not to estimate only once when choosing, but to keep checking with each month’s fixed values.
Background to This Approach
In fields such as high-voltage and extra-high-voltage supply, where rate structures are complex and contract terms differ by company, estimates using assumed averages cannot fully reflect reality, so the starting point for comparison is first to understand your own actual usage correctly.
Summary
Forward-looking simulation requires setting as assumed values not only your own usage and share of use by time period but also hard-to-predict variable factors such as fuel prices and JEPX spot market prices, making it quite difficult to foresee an accurate amount.
It is not a solution in itself, but as one guide there is the method of applying each company’s rate structure to past actual results. Its strengths are that usage and unit prices can all be calculated with fixed values, and that it can accurately reflect even the “overlap” between the seasons and hours when market prices are high and those when your company uses a lot.
In fact, putting past Januarys into the three current plans you can contract now (Basic, Zero Market Adjustment and Market-Linked) with the same factory and the same usage pattern showed that the Market-Linked Plan was the most expensive in January 2021, when the market was turbulent, while the Zero Market Adjustment Plan was instead the most expensive in January 2023, when fuel was expensive; the favorable plan switched with each year’s conditions. Even with the same inputs, the result changes greatly depending on the plan’s design.
This back-testing can be used in the same way for other companies’ plans, such as those of new entrant retailers, and continuing to check plans under consideration with each month’s fixed values even after signing gives clues for the next review of terms. Checking with actual unit prices how much variation a plan is designed to absorb gives clues for thinking about price risk. Note, however, that back-testing against actual results is also only a check of past trends and does not guarantee future electricity charges. How to compare high-voltage electricity as a whole is as confirmed in Part 1.
This article is based on published materials from the Ministry of Economy, Trade and Industry and its Agency for Natural Resources and Energy, the Electricity and Gas Market Surveillance Commission, the Organization for Cross-regional Coordination of Transmission Operators (OCCTO) and other sources. The English translations of figures are by ENERGY ADVISOR and are not official translations. When using this information for decisions, please check the original sources. When we find an error, we correct the article and note the date of the correction.
Sources
- TEPCO Energy Partner, “FY2026 Electricity Rate Table (Extra-High-Voltage and High-Voltage)” (in Japanese), effective April 1, 2026. https://www.tepco.co.jp/ep/corporate/plan_h/pdf/2026minaoshisiryou.pdf
- TEPCO Energy Partner, “Electricity Rate Table (Extra-High-Voltage and High-Voltage)” (in Japanese), from November 1, 2026. https://www.tepco.co.jp/ep/corporate/plan_h/pdf/202611minaoshisiryou.pdf
- Japan Electric Power Exchange (JEPX), “Spot Market Trading Results” (published data; checked against values downloaded and aggregated October 22, 2026). https://www.jepx.jp/electricpower/market-data/spot/
- TEPCO Energy Partner, “Notice of Fuel Cost Adjustment and Other Rates” (in Japanese), January 2021 https://www.tepco.co.jp/ep/corporate/adjust2/backnumber/2101.html / January 2023 https://www.tepco.co.jp/ep/corporate/adjust2/backnumber/2301.html / January 2025 https://www.tepco.co.jp/ep/corporate/adjust2/backnumber/2501.html
- METI, “Setting Purchase Prices from FY2026 and the Surcharge Rate for FY2026” (in Japanese), March 19, 2026. https://www.meti.go.jp/press/2025/03/20260319004/20260319004.html
- EGC, Meeting for System Design, “Spot Market Price Surge in Winter FY2020” (in Japanese), April 28, 2021 (Subcommittee on Electricity and Gas Basic Policy, 34th meeting, Material 9, separate volume; Figure I-2, p.3; Figure II-1, p.22; Figure II-2, p.23). https://www.meti.go.jp/shingikai/enecho/denryoku_gas/denryoku_gas/pdf/034_b09_00.pdf / Draft of the same report: Meeting for System Design, Material 4-1 (the cover does not state the meeting number; the 60th meeting, judging from the number in the URL), “Spot Market Price Surge in Winter FY2020 (draft)” (in Japanese). https://www.egc.meti.go.jp/activity/emsc_system/pdf/060_04_01.pdf
- Agency for Natural Resources and Energy, “Verification of the Tight Supply-Demand Balance and Market Price Surge in Winter FY2020: Interim Report (draft)” (in Japanese), Subcommittee on Electricity and Gas Basic Policy, 34th meeting, April 28, 2021, Material 9 (the report above is a separate volume of this material). https://www.meti.go.jp/shingikai/enecho/denryoku_gas/denryoku_gas/pdf/034_09_00.pdf
- Agency for Natural Resources and Energy, “Progress of Full Retail Electricity Liberalization” (in Japanese), Subcommittee on Electricity and Gas Basic Policy, 86th meeting, Material 3, February 28, 2025. https://www.meti.go.jp/shingikai/enecho/denryoku_gas/denryoku_gas/pdf/086_03_00.pdf