Electricity demand and supply capacity must always be almost equal; when supply capacity is short, the frequency falls, and when it is in surplus, the frequency rises. The deviation between plan and actual results (an imbalance) is filled by the general transmission and distribution company and settled at the imbalance price. Imbalance prices can be checked for each 30-minute period and each area on the Imbalance Price Information Website. This article explains how to use the website to check the latest and past prices and the basis of their calculation. The basics of imbalances are explained in Article 04, and the calculation rules in Article 05.
The Imbalance Price Information Website
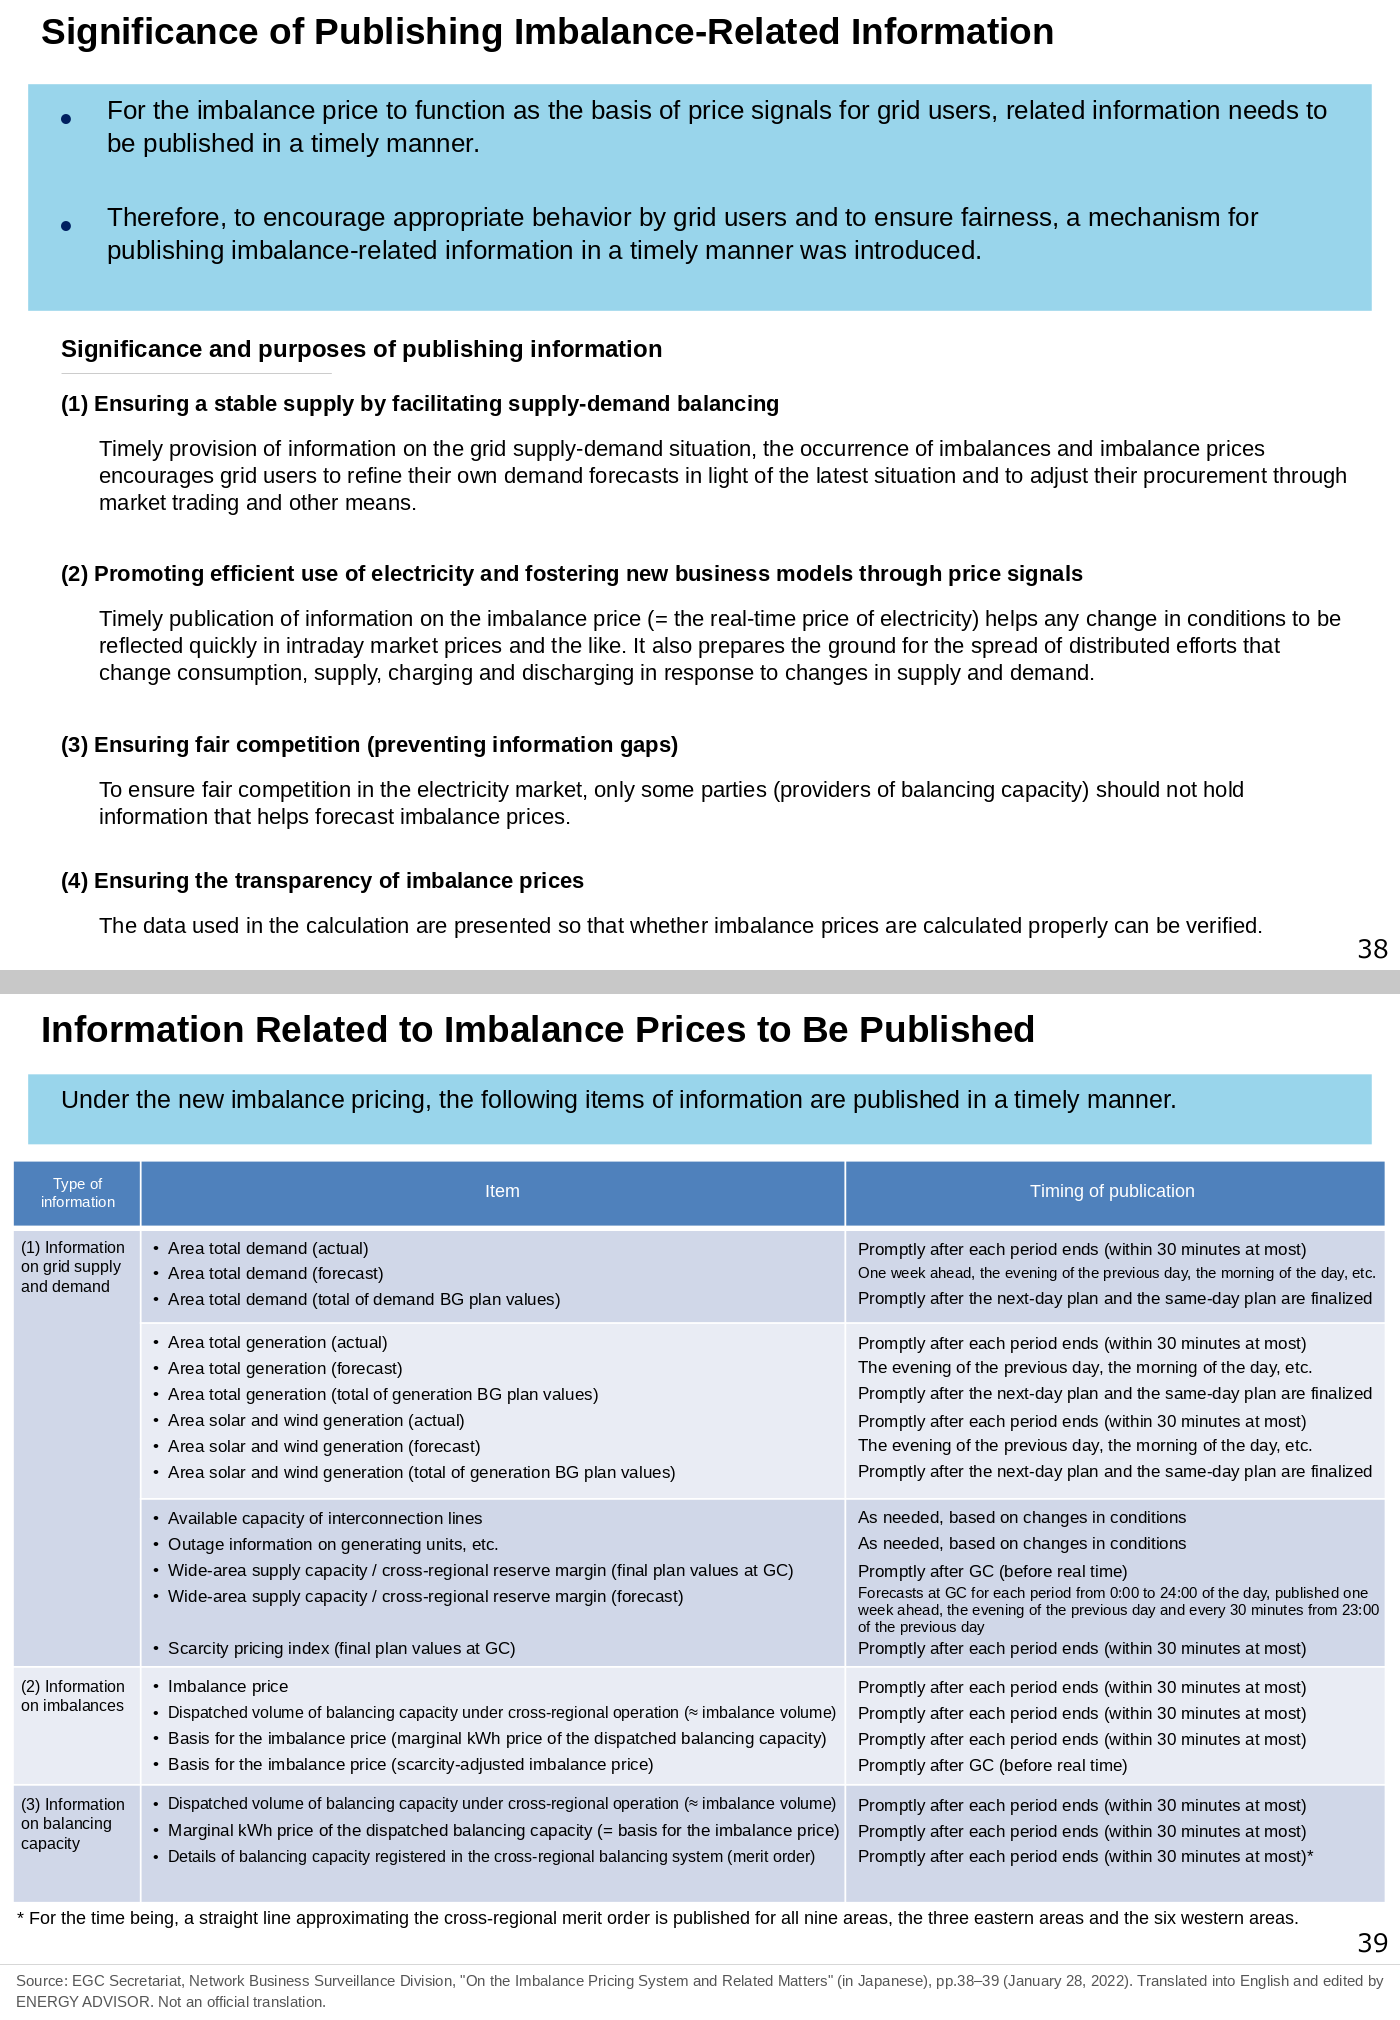
Imbalance prices can be checked on the “Imbalance Price Information Website (https://www.imbalanceprices-cs.jp/).” The site publishes imbalance prices in a timely manner.
The site states that “the nine general transmission and distribution companies other than Okinawa Electric Power calculate and publish the information.” A general transmission and distribution company (GT&D company) operates the grid in each area and is ultimately responsible for matching supply and demand. The copyright notice at the bottom of the page names three companies: Kansai Transmission and Distribution, Chubu Electric Power Grid and Kyushu Electric Power Transmission and Distribution. Prices for the Okinawa area are published on Okinawa Electric Power’s website (linked from the top page).
No user registration or digital certificate is needed to view the site. The published data can be used for commercial or non-commercial purposes without any procedure. Prices are shown excluding tax.
Viewing the Latest Prices and Imbalance Volumes
When you open the site, the latest imbalance prices for each area are shown in a graph. For each area, the surplus price is drawn as a solid line and the shortfall price as a dotted line, and hovering over the graph shows the price for each 30-minute period. The screen does not update automatically, so press the refresh button to see the latest period.
Clicking “Detailed graphs here” lets you check the imbalance volume for each area as well.
In the screen example in the original post, the grid’s imbalance volume was in surplus and the imbalance price was ¥0/kWh. From this, it can be inferred that solar output curtailment was taking place. This is because, when the grid is in surplus during output curtailment of solar and other sources, the imbalance price is ¥0/kWh.
Imbalance prices are normally published within 30 minutes after the end of the delivery period, and that value becomes the final value. If the data used in the calculation are replaced, the price may later be recalculated and replaced. Replacements are listed under “Update information.”
Downloading Past Prices as CSV Files
From “Download published files” on the top page, the following three types of files are available.
| File | Content |
|---|---|
| Imbalance prices | Surplus and shortfall prices by area and 30-minute period (CSV for this month and last month; past files from the list) |
| Imbalance price calculation basis | Items used to calculate the prices (CSV for this month and last month; past files from the list) |
| Details of dispatched balancing capacity | Information on the balancing capacity dispatched (from a page where you select the display range) |
File names include a number showing which update it is. For example, “202610_imbalance-price_01.csv” and “202610_imbalance-basis_01_00.csv.” When only the calculation basis file is updated, the decimal part increases; when both are updated, the integer part increases.
Main Items in the Calculation Basis File
In the calculation basis file (CSV, Shift_JIS character encoding), the following 19 items that form the basis of the imbalance price calculation can be checked for each of the nine areas and 48 periods. The items were the same in the October 2026 file.
| No. | Item (column name in the file, in Japanese) | Item (English) |
|---|---|---|
| 1 | インバランス量(kWh) | Imbalance volume (kWh) |
| 2 | 系統余剰・不足(0:不足、1:余剰、-:なし) | Grid surplus/shortfall (0: shortfall, 1: surplus, -: none) |
| 3 | 広域運用分断エリア区分(1-9) | Cross-regional operation split-zone code (1-9) |
| 4 | 補正料金算定インデックス(%) | Scarcity pricing index (%) |
| 5 | 調整力の限界的なkWh価格(円/kWh) | Marginal kWh price of balancing capacity (¥/kWh) |
| 6 | 卸市場価格P(円/kWh) | Wholesale market reference price P (¥/kWh) |
| 7 | 需給ひっ迫時補正インバランス料金単価(円/kWh) | Scarcity-adjusted imbalance price (¥/kWh) |
| 8 | 電源Ⅲ出力抑制の有無(0:無、1:有) | Curtailment of former Type III generators (0: no, 1: yes) |
| 9 | 電源Ⅲ出力抑制時単価の適用有無(0:無、1:適用) | Former Type III curtailment price applied (0: no, 1: applied) |
| 10 | 電源Ⅲ出力抑制時単価(円/kWh) | Former Type III curtailment price (¥/kWh) |
| 11 | 再エネ出力抑制の有無(0:無、1:有) | Renewable output curtailment (0: no, 1: yes) |
| 12 | 再エネ出力抑制時単価の適用有無(0:無、1:適用) | Renewable curtailment price applied (0: no, 1: applied) |
| 13 | 電力使用制限有無(0:無、1:有) | Mandatory electricity use restriction (0: no, 1: yes) |
| 14 | 電力使用制限時の限界的なkWh価格(円/kWh) | Marginal kWh price during mandatory electricity use restriction (¥/kWh) |
| 15 | 計画停電有無(0:無、1:有) | Rolling blackouts (0: no, 1: yes) |
| 16 | 計画停電時の限界的なkWh価格(円/kWh) | Marginal kWh price during rolling blackouts (¥/kWh) |
| 17 | ブラックアウト発生有無(0:無、1:有(当日)、2:有(翌日以降)) | Area-wide blackout (0: no, 1: yes (same day), 2: yes (following days)) |
| 18 | ブラックアウト発生時のインバランス料金単価(円/kWh) | Imbalance price during an area-wide blackout (¥/kWh) |
| 19 | 卸市場停止時等参照価格(円/kWh) | Reference price when the wholesale market is suspended, etc. (¥/kWh) |
The main items are read as follows.
- 1 Imbalance volume: The imbalance volume (kWh) for each area and period
- 3 Cross-regional operation split-zone code: An item showing the zones when cross-area operation of balancing capacity (cross-regional operation) is split because of interconnection congestion. When cross-regional operation is split, the marginal kWh price is calculated separately for each split area (Interim Report 2(2)④)
- 4 Scarcity pricing index: The value (%, to two decimal places) for each area and period. In the example in the original post’s figure, every area was at 30% or more, showing there was ample supply capacity
- 6 Wholesale market reference price P: A reference price used when data have not arrived, among other cases. It is the simple average of five trades by five different companies close to real time in the intraday market
Reading the Scarcity Pricing Index (Cross-Regional Reserve Margin) and the Scarcity-Adjusted Price
Item 4, the scarcity pricing index, is an indicator of the upward headroom the GT&D company can use for adjustment. Since FY2024 (April 2024–March 2025), it has referred to the cross-regional reserve margin published by the Organization for Cross-regional Coordination of Transmission Operators, JAPAN (OCCTO). The cross-regional reserve margin is a ratio, viewed across areas, of how much spare supply capacity there is relative to demand.
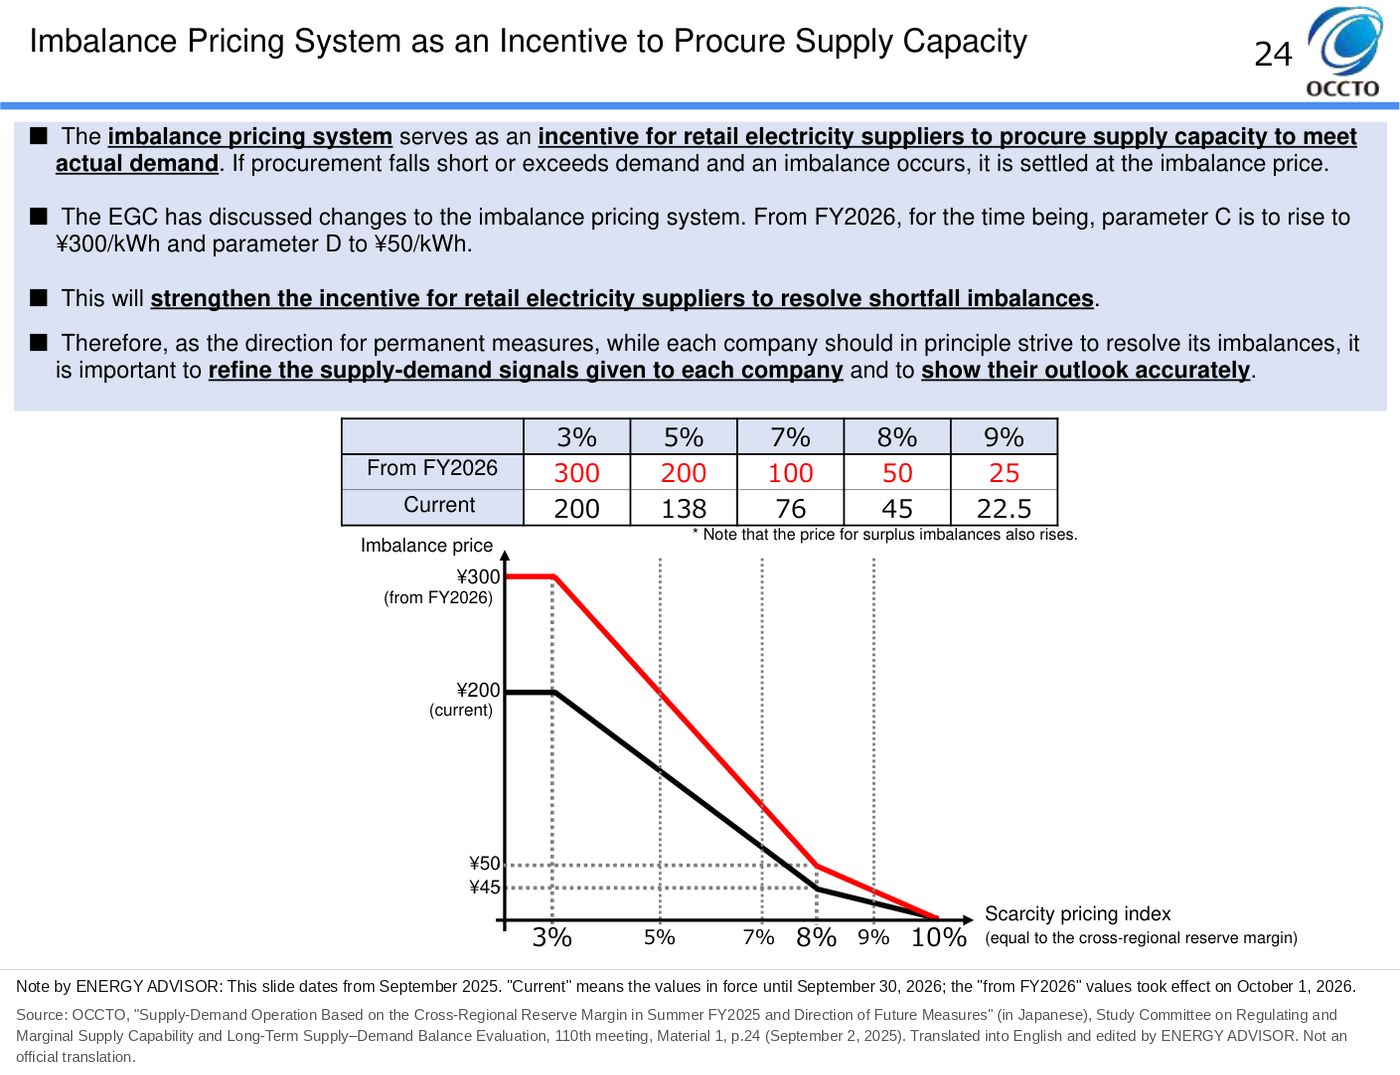
Item 7, the scarcity-adjusted imbalance price, is shown as ¥0/kWh when the index is 10% or more. When the index falls below 10%, a price appears in this column. The imbalance price is the higher of item 5, the marginal kWh price, and item 7.
From October 1, 2026, the item 7 price is ¥50/kWh at an index of 8%, ¥200/kWh at 5% and ¥300/kWh below 3%. Until September 2026, the cap was ¥200/kWh. The formula is explained in Article 05.
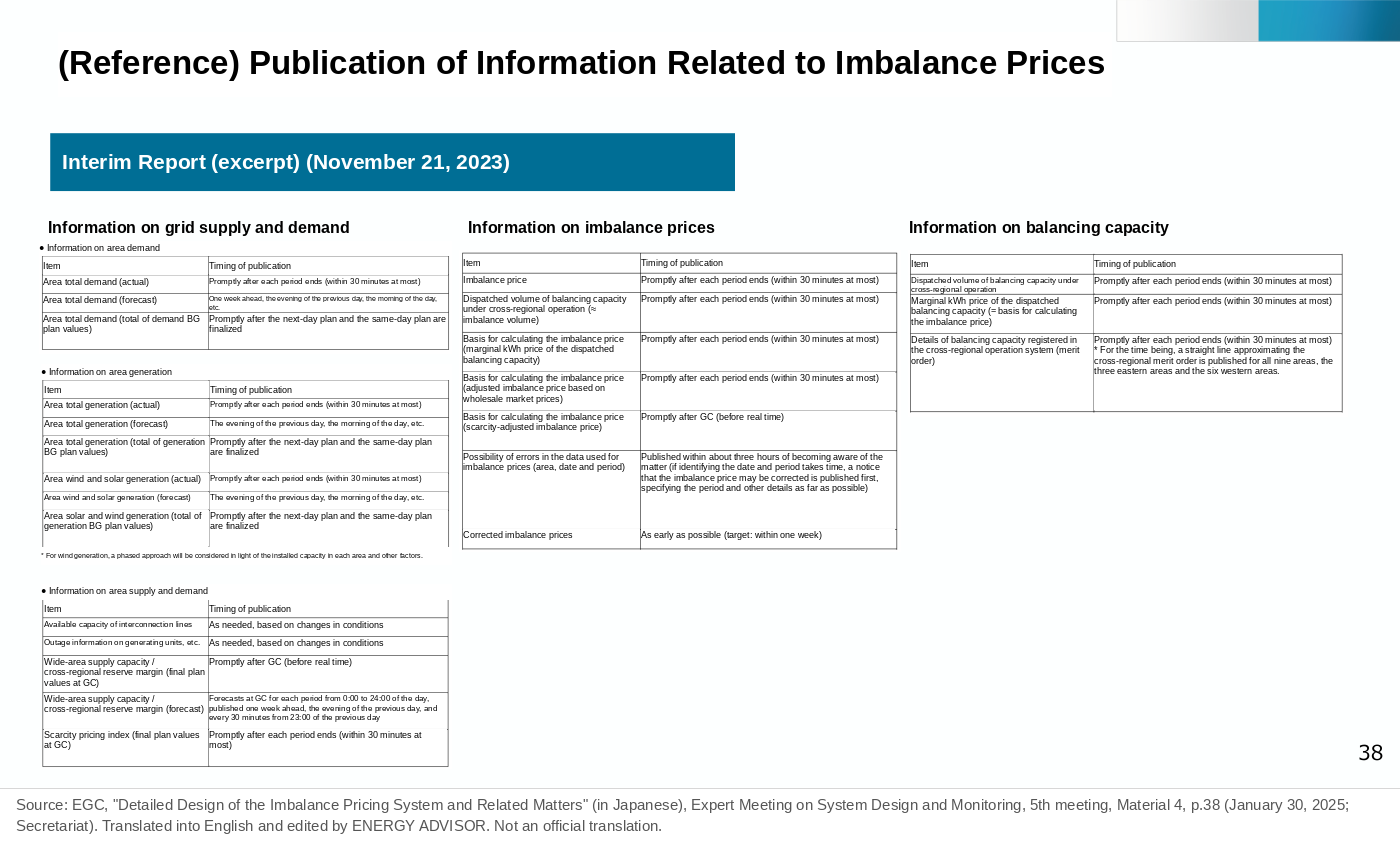
The calculation basis file is updated twice every 30 minutes. This is because item 7, the scarcity-adjusted imbalance price, is published promptly after gate closure (one hour before real time), while the other items are published after real time. For this reason, when the supply-demand balance is tight and the imbalance price looks likely to rise, the scarcity-adjusted price can be checked before real time.
Checking Whether the Cumulative Price Threshold Mechanism Has Been Triggered
The cumulative price threshold mechanism started on October 1, 2026. When periods with an area price of ¥200/kWh or more in the day-ahead market (spot market) reach 30 periods in the preceding seven days, the cap on the scarcity-adjusted imbalance price is lowered to ¥100/kWh from the next day. In the Okinawa area, the judgment is based on the imbalance price.
The October 2026 calculation basis file has no item showing that this mechanism has been triggered. Whether it has been triggered can be read from whether the item 7 price is capped at ¥100/kWh. The trigger condition can be checked from area prices in the day-ahead market of the Japan Electric Power Exchange (JEPX).
Summary
- Imbalance prices can be checked on the Imbalance Price Information Website. The nine GT&D companies other than Okinawa Electric Power calculate and publish them
- The latest prices and imbalance volumes can be checked in graphs, and past prices and calculation bases in CSV files
- Of the 19 items in the calculation basis file, item 4, the scarcity pricing index, and item 7, the scarcity-adjusted imbalance price, are especially important when the supply-demand balance is tight
- From October 1, 2026, the cap on the scarcity-adjusted imbalance price is ¥300/kWh. When a tight supply-demand balance is expected, checking prices on this site in a timely manner is recommended
When a tight supply-demand balance is expected, the cross-regional reserve margin also falls. The cross-regional reserve margin can be checked on OCCTO’s “Cross-Regional Reserve Margin Web Publication System” and on each GT&D company’s electricity forecast (denki yoho) page.
This article is based on published materials from the Ministry of Economy, Trade and Industry and its Agency for Natural Resources and Energy, the Electricity and Gas Market Surveillance Commission, the Organization for Cross-regional Coordination of Transmission Operators (OCCTO) and other sources. The English translations of figures are by ENERGY ADVISOR and are not official translations. When using this information for decisions, please check the original sources. When we find an error, we correct the article and note the date of the correction.
Sources
- Imbalance Price Information Website (top page and published files; viewed October 22, 2026) (in Japanese). https://www.imbalanceprices-cs.jp/
- Imbalance Price Information Website, “Imbalance Price Calculation Basis,” October 2026 (202610_imbalance-basis_01_00.csv, updated October 22, 2026) (in Japanese). https://www.imbalanceprices-cs.jp/public/basis/2026/10/202610_imbalance-basis_01_00.csv
- Imbalance Price Information Website, “Frequently Asked Questions on the Central Imbalance Price Calculation System,” 1-9, 2-1, 2-2, 2-4, 2-5, 2-6, 2-9, 2-10, 2-11, 3-1 and 3-5 (updated October 1, 2026) (in Japanese). https://www.imbalanceprices-cs.jp/show/faq/faqInquiry.pdf
- Electricity and Gas Market Surveillance Commission, “Imbalance Pricing System from FY2022 (Interim Report)” (reference to the cross-regional reserve margin; publication timing) (in Japanese). https://www.egc.meti.go.jp/activity/emsc_systemsurveillance/pdf/010_03_03.pdf
- OCCTO, Cross-Regional Reserve Margin Web Publication System (confirmed accessible on October 22, 2026) (in Japanese). https://web-kohyo.occto.or.jp/kks-web-public
- EGC Secretariat, Network Business Surveillance Division, “On the Imbalance Pricing System and Related Matters” (January 28, 2022) (in Japanese). https://www.egc.meti.go.jp/info/public/pdf/20220117001b.pdf
- Electricity and Gas Market Surveillance Commission, Expert Meeting on System Design and Monitoring, 5th meeting, Material 4, “Detailed Design of the Imbalance Pricing System” (January 30, 2025) (in Japanese). https://www.egc.meti.go.jp/activity/emsc_systemsurveillance/pdf/005_04_00.pdf
- TEPCO Power Grid, electricity forecast (denki yoho) (in Japanese). https://www.tepco.co.jp/forecast