The imbalance price is the unit price used to settle the deviation between plan and actual results (an imbalance). It is set for each 30-minute period and each area. Electricity demand and supply capacity must always be almost equal; when supply capacity is short, the frequency falls, and when it is in surplus, the frequency rises. The general transmission and distribution company fills this deviation, and the cost is settled at the imbalance price. This article explains the five rules that set the imbalance price and the formula used when the supply-demand balance is tight from October 1, 2026. The basics of imbalances are explained in Article 04 of this series.
Five Rules That Set the Imbalance Price
The imbalance price is the energy unit price (¥/kWh) used to settle shortfall and surplus imbalances. It is calculated from the cost of the balancing capacity and other items used when the general transmission and distribution company (GT&D company) adjusted the imbalance. A GT&D company operates the grid in each area and is ultimately responsible for matching supply and demand.
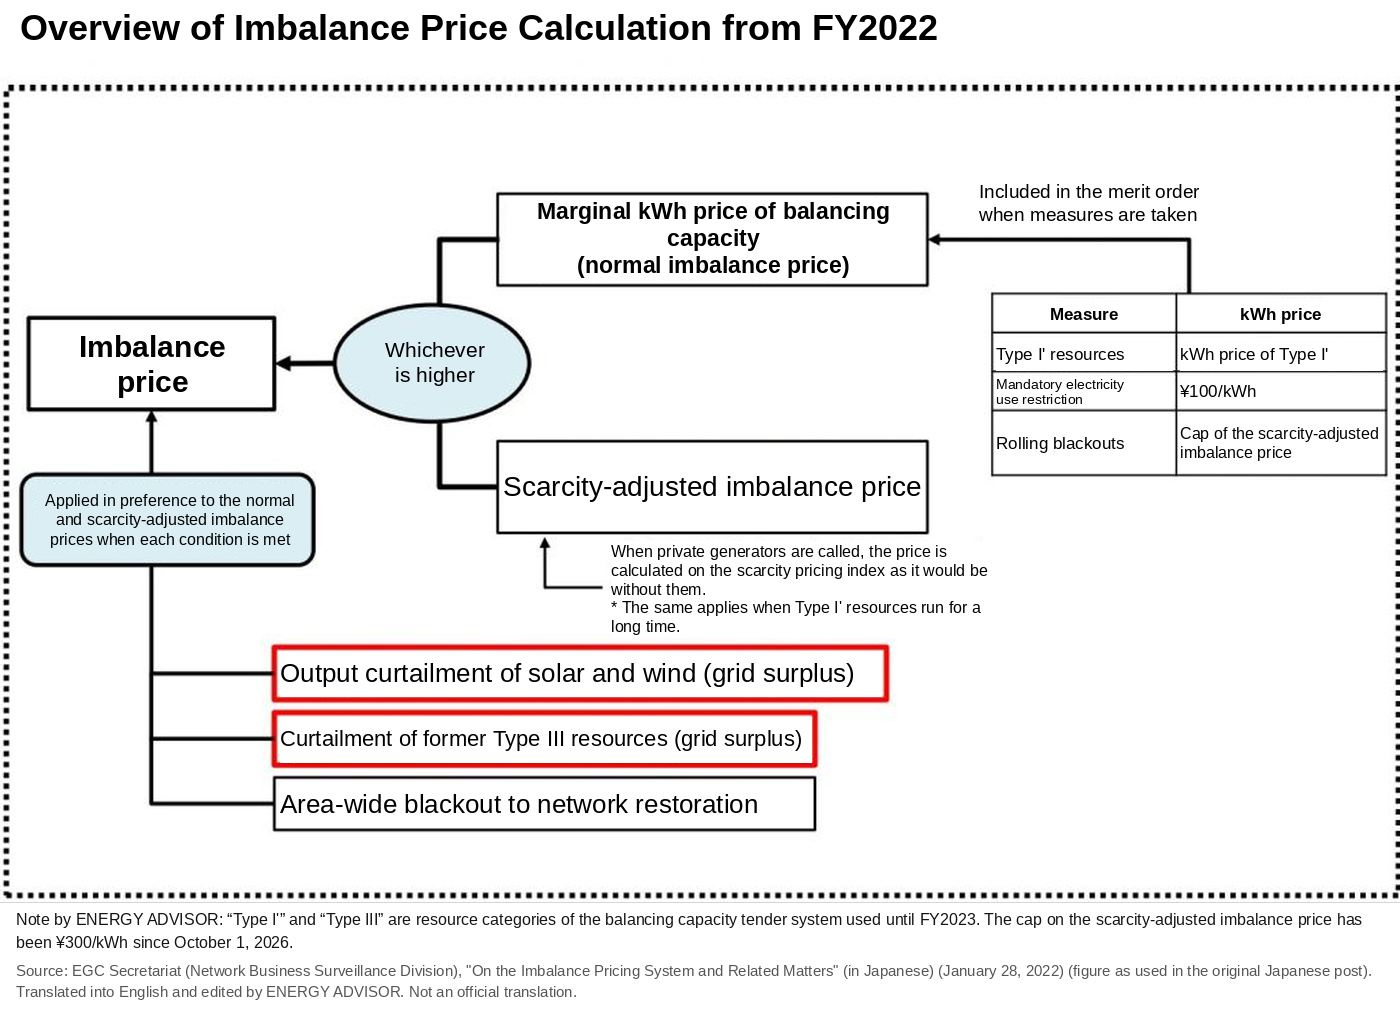
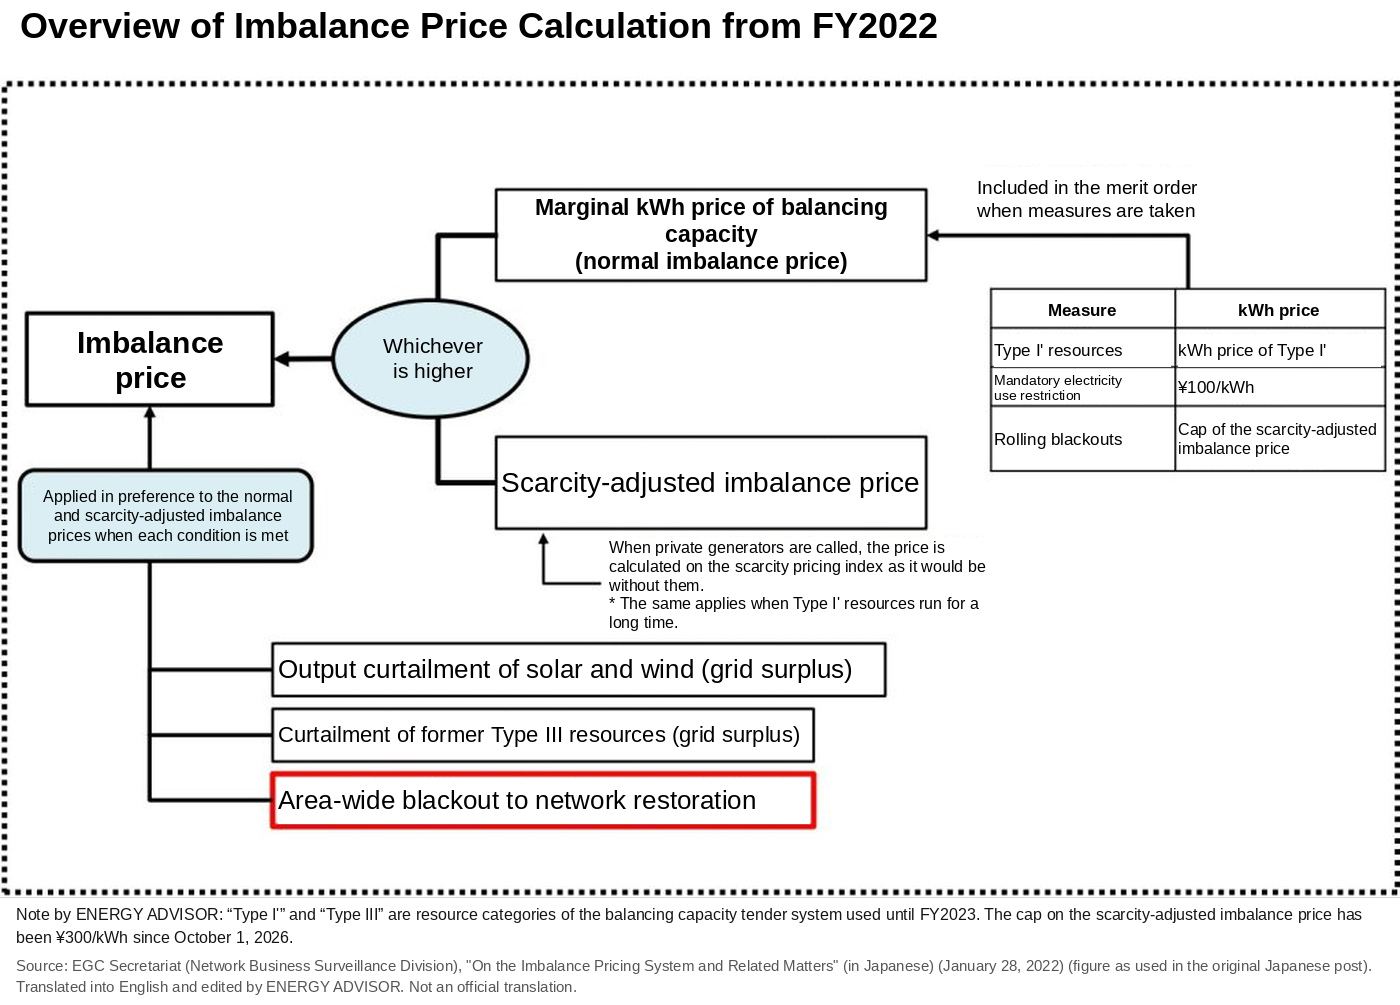
The calculation methods fall broadly into the following five.
| Rule | When it applies |
|---|---|
| (1) Marginal kWh price of balancing capacity | Normal conditions |
| (2) Scarcity-adjusted imbalance price | When the scarcity pricing index is below 10% (the higher of this and (1)) |
| (3) Price during solar and wind output curtailment | When output curtailment is carried out and the grid is in surplus |
| (4) Price during curtailment of offline generators (former Type III) | When the output of offline generators is reduced |
| (5) Price during an area-wide blackout | When a blackout of an entire area occurs |
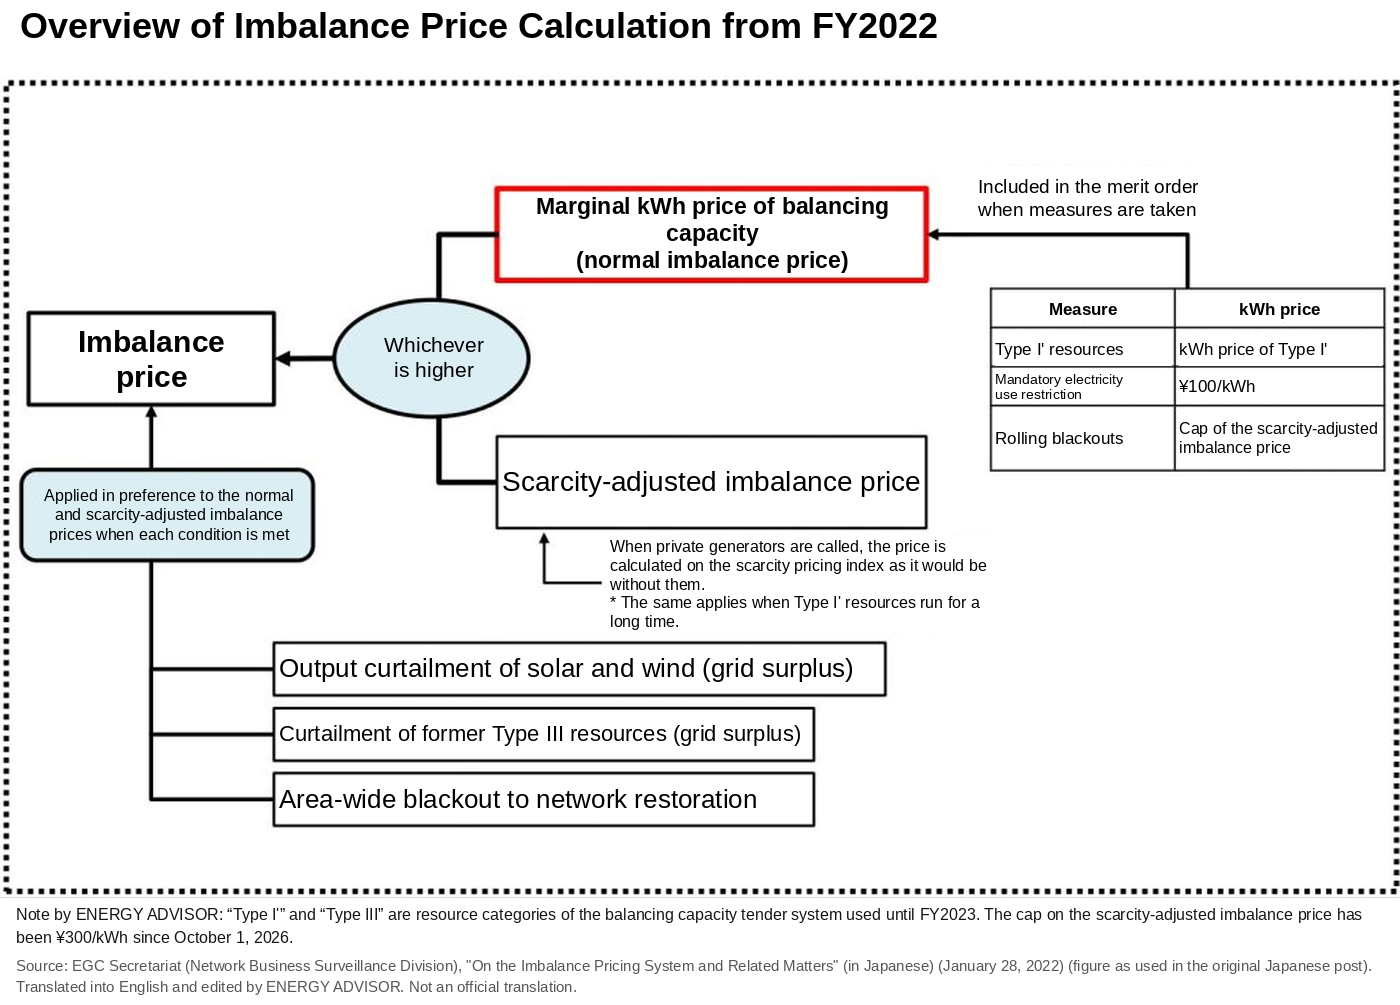
Normal Conditions: The Marginal kWh Price of Balancing Capacity
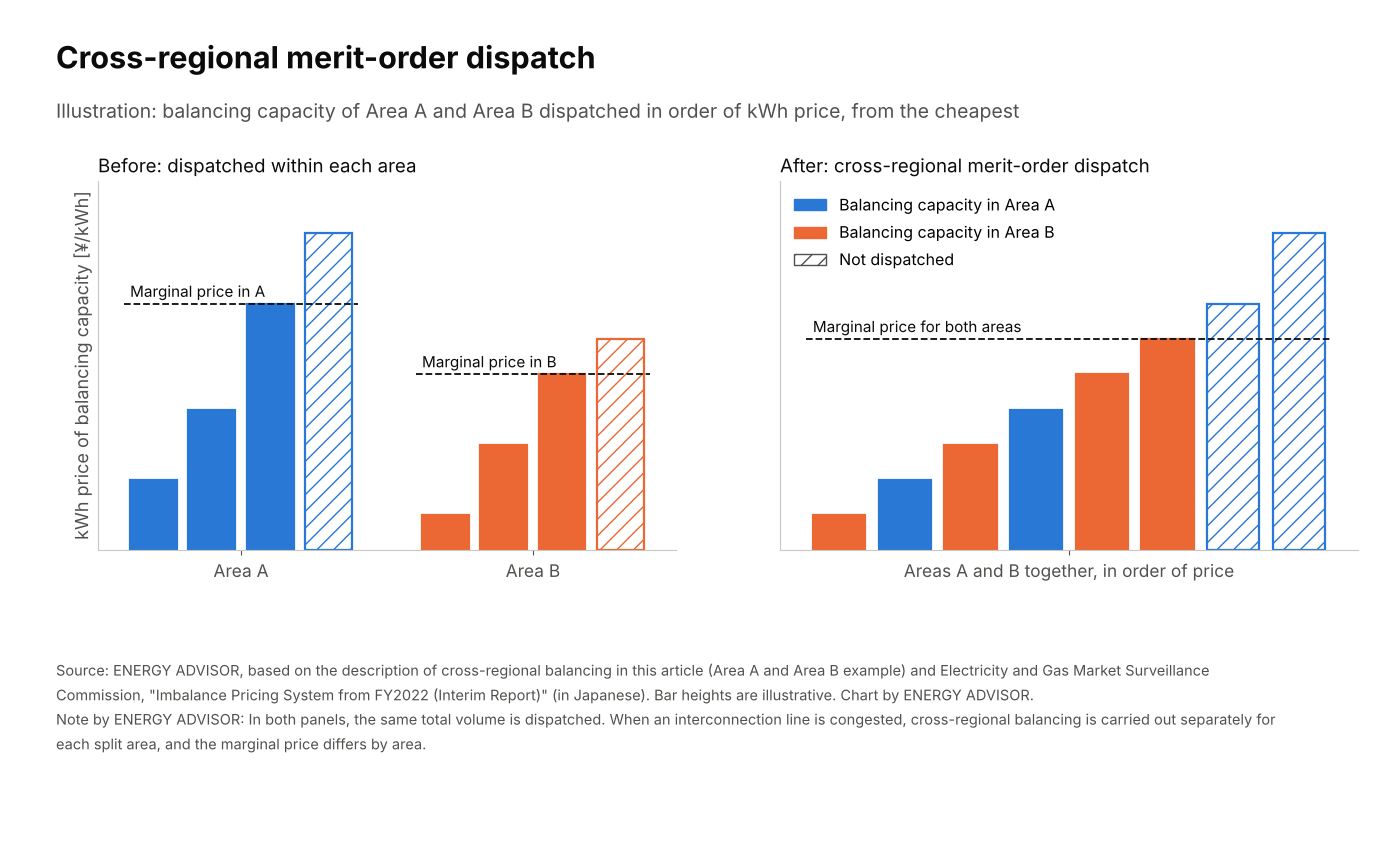
To adjust imbalances, the GT&D company raises or lowers the output of generators and other resources secured in advance as balancing capacity. As output goes up or down, generation costs also increase or decrease. These costs are reflected in the imbalance price as the “marginal kWh price of balancing capacity.”
- For a shortfall imbalance, the company pays for the electricity supplied to make the adjustment
- For a surplus imbalance, the company receives payment for the electricity taken off its hands
The marginal kWh price is the highest price, that of the last resource adjusted, when generator output is raised in order of adjustment cost, from the cheapest (merit order).
The balancing capacity used here includes balancing capacity procured in the Supply and Demand Balancing Market (balancing market) and balancing capacity secured through spare-capacity utilization contracts. A spare-capacity utilization contract is a contract that allows the GT&D company to use the spare capacity of resources contracted in the capacity market (a market that secures future supply capacity). From gate closure (one hour before real time) onward, the GT&D company dispatches these resources, and their marginal kWh price is reflected in the imbalance price.
Cross-Regional Balancing
Balancing capacity is dispatched across areas through the cross-regional interconnection lines, in merit order, using the cross-regional balancing system (KJC). Since FY2021 (April 2021–March 2022), imbalances have been handled mainly through this cross-regional balancing.
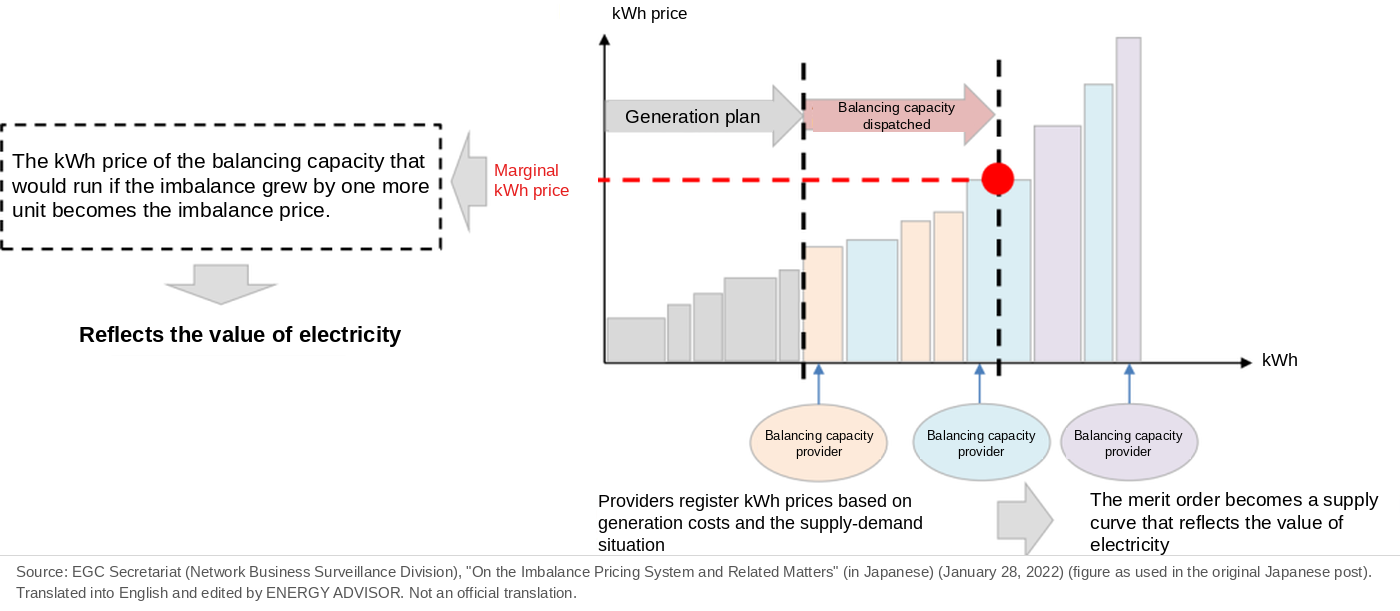
Before that, balancing capacity was dispatched within each area in order of unit price, from the cheapest. With the development of KJC, it became possible to adjust in order of unit price across areas, and cross-regional merit-order dispatch began. For example, balancing capacity that had been dispatched separately in Area A and Area B can now be dispatched together for the two areas in order of price, from the cheapest, and the cost of balancing capacity fell.
When an interconnection line between areas is congested and balancing capacity cannot flow, cross-regional balancing is carried out separately for each split area. As a result, the marginal kWh price differs by area, and so does the imbalance price.
5-Minute Prices and the 30-Minute Period Price
From March 2023, instructions for cross-regional balancing changed from every 15 minutes to every 5 minutes. The marginal kWh price is set for each 30-minute period, but its value is obtained as follows.
- The marginal kWh price is calculated for every 5 minutes
- The price for each 5 minutes is weighted by the imbalance volume in that 5 minutes and averaged to give the price for the 30-minute period
- When there are both upward and downward instructions in the same period, equal volumes are offset, and the remainder is used for the weighted average
Tight Supply-Demand Balance: The Scarcity-Adjusted Imbalance Price and the Cross-Regional Reserve Margin
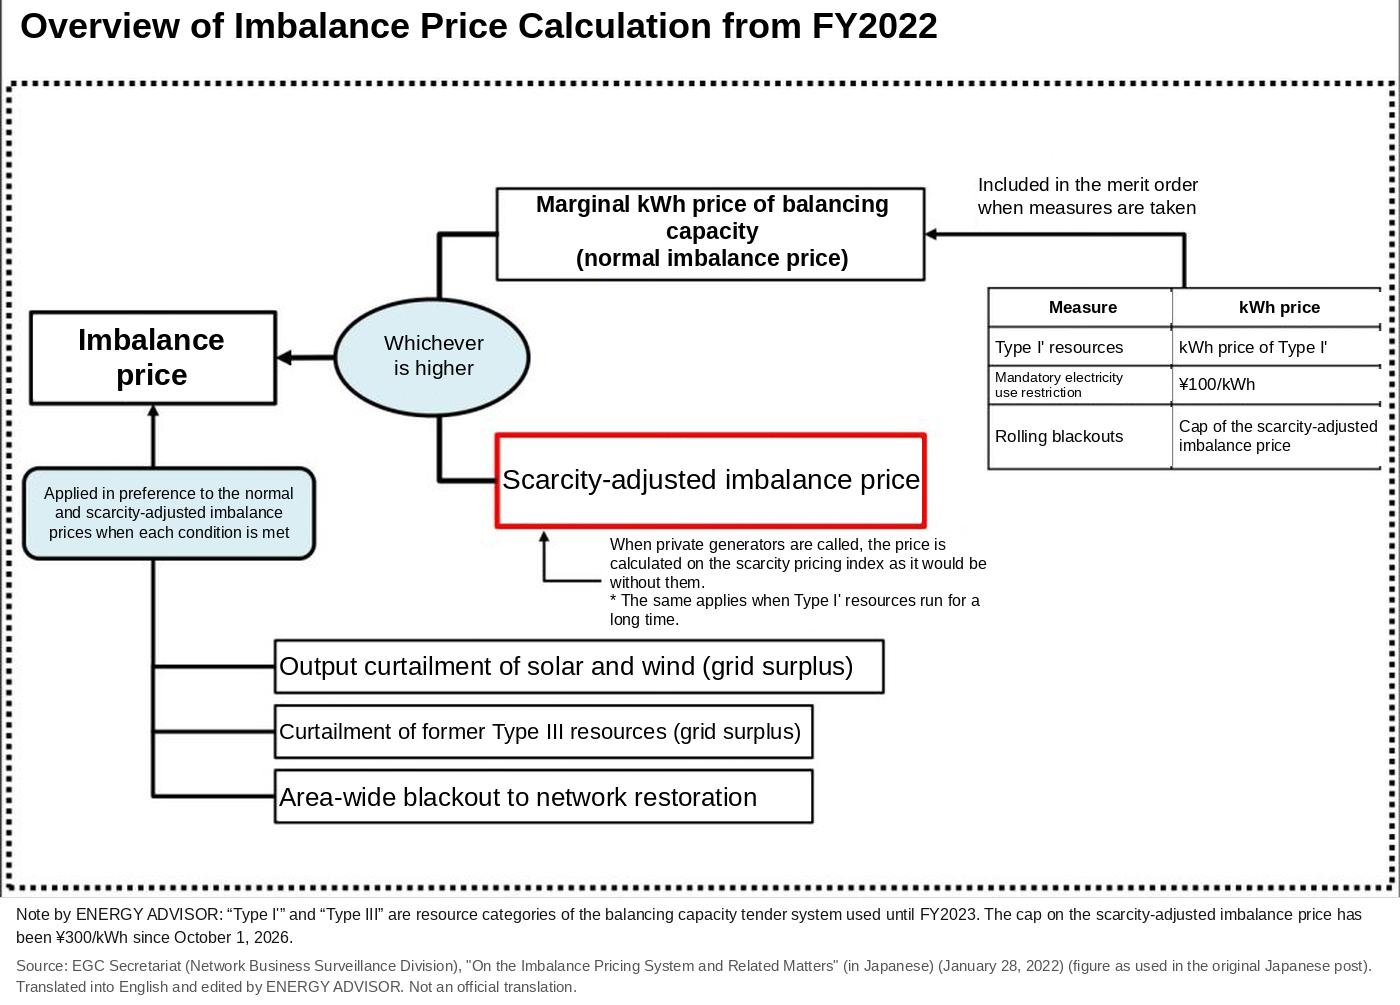
When the supply-demand balance is tight, supply capacity is short, and the cost needed for adjustment may also increase. In addition, shortfall imbalances when the balance is tight increase the risk of large-scale blackouts and the cost of securing supply capacity urgently. For this reason, a “scarcity-adjusted imbalance price” is calculated by a method separate from the normal price.
The imbalance price is the higher of the “marginal kWh price of balancing capacity” and the “scarcity-adjusted imbalance price.”
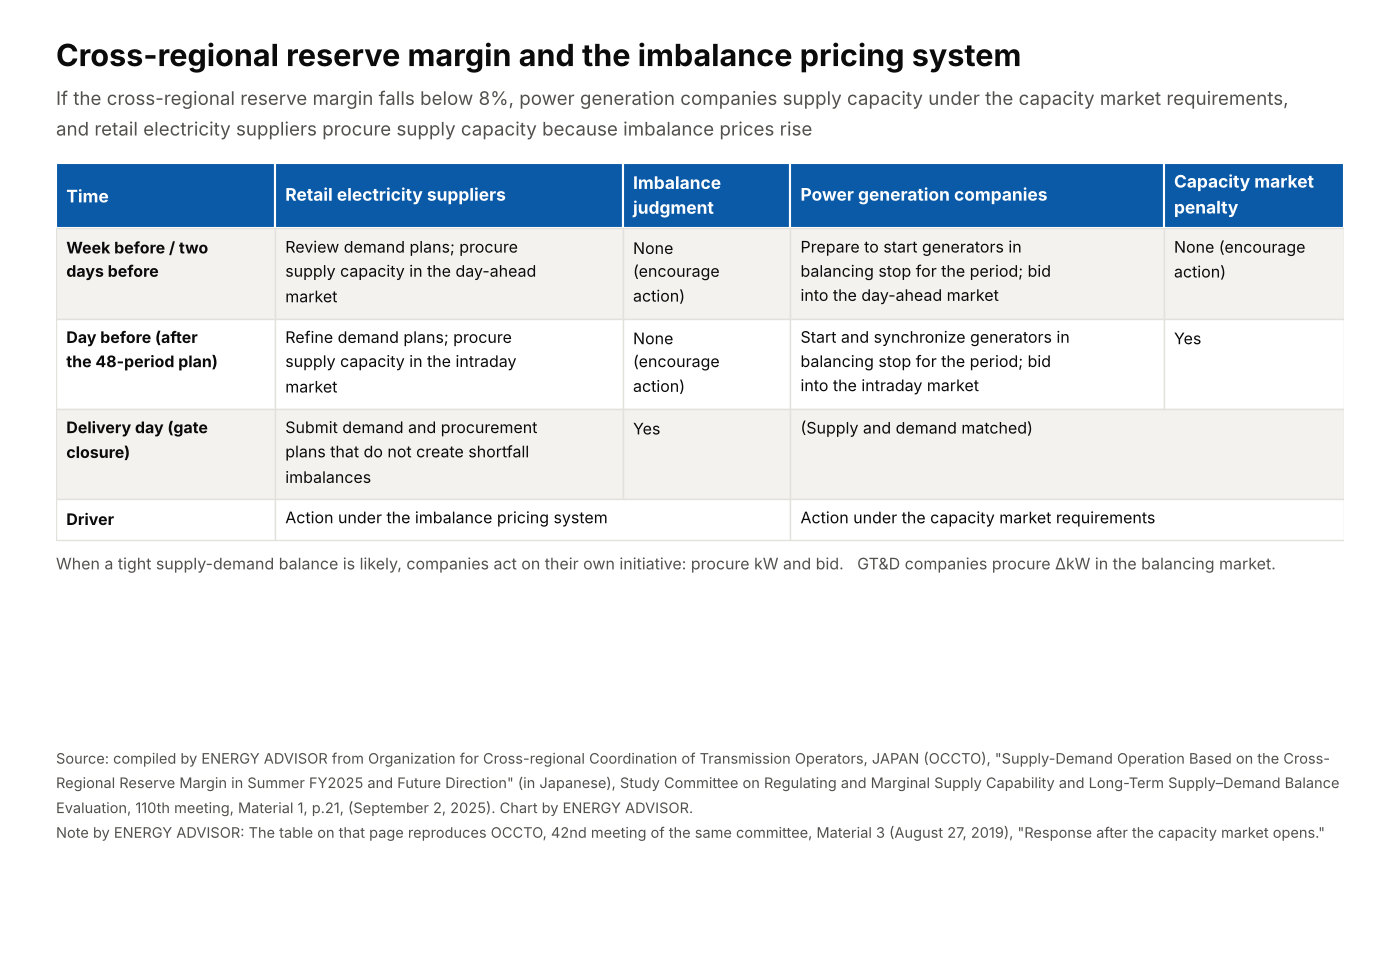
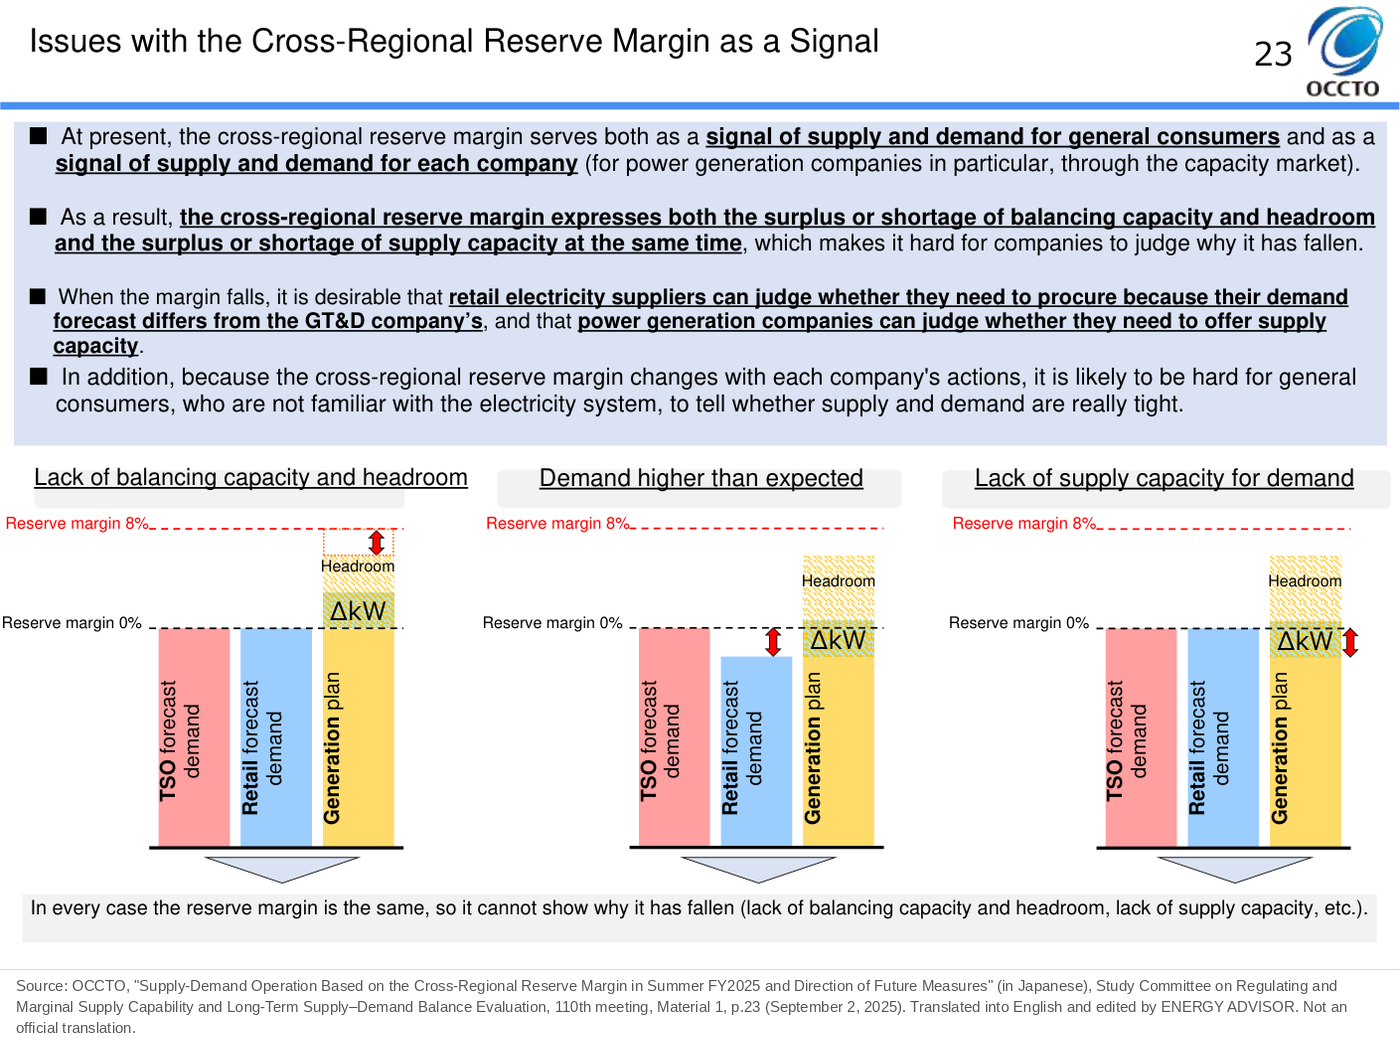
The scarcity-adjusted imbalance price is calculated when the scarcity pricing index falls below 10%, and it rises as the index falls. The scarcity pricing index is an indicator of the upward headroom that the GT&D company can use to adjust imbalances. Since FY2024, it has referred to the cross-regional reserve margin published by OCCTO (the Organization for Cross-regional Coordination of Transmission Operators, JAPAN). The cross-regional reserve margin is a ratio, viewed across areas, of how much spare supply capacity there is relative to demand. Whenever the calculation method of the cross-regional reserve margin is revised, it is to be checked whether to reflect the revision in the scarcity pricing index.
By making the price rise when the supply-demand balance is tight, the system is expected to draw out additional supply capacity, such as demand response (DR: customers reducing their electricity use) and in-house generation. It is also expected to encourage customers to save electricity.
Formula and Price Table from October 2026
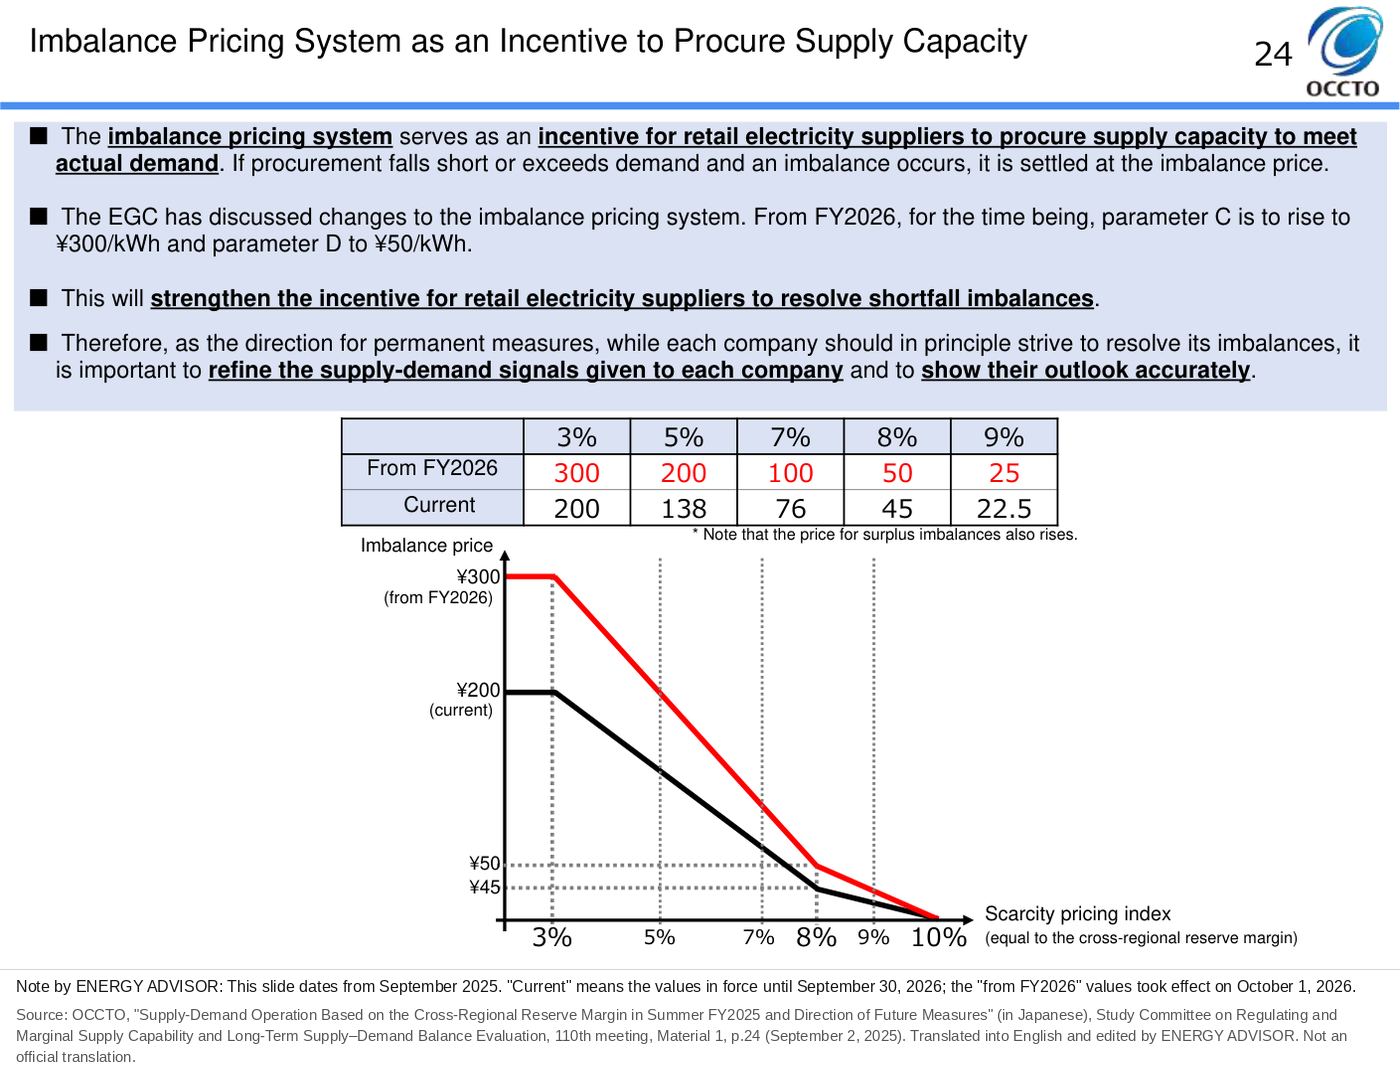
The shape of the scarcity-adjusted imbalance price is determined by the cap price (parameter C) and the price at the kink (parameter D). From October 1, 2026, parameter C went from ¥200/kWh to ¥300/kWh, and parameter D from ¥45/kWh to ¥50/kWh.
The formula is as follows.
| Scarcity pricing index | Scarcity-adjusted imbalance price (¥/kWh) |
|---|---|
| Below 3% | 300 |
| 3% to below 8% | 450 − 50 × index value |
| 8% to below 10% | 250 − 25 × index value |
| 10% or more | 0 (not calculated) |
The price at each index value, side by side with the price before the revision, is as follows.
| Index | 3% or less | 5% | 7% | 8% | 9% | 10% |
|---|---|---|---|---|---|---|
| Until September 2026 (¥/kWh) | 200 | 138 | 76 | 45 | 22.5 | 0 |
| From October 2026 (¥/kWh) | 300 | 200 | 100 | 50 | 25 | 0 |
What changed is mainly the slope once the index falls below 8%. The range from 8% to below 10% is almost unchanged. At an index of 5%, the price reaches ¥200/kWh, the same as the cap before the revision.
The index is used to two decimal places. The Imbalance Price Information Website states that the cap is, in principle, ¥600/kWh, and that ¥300/kWh is a provisional measure. The formula for ¥600/kWh is also posted as the “future” value.
The system also includes a “kWh scarcity-adjusted imbalance price,” which applies ¥80/kWh when the kWh reserve ratio (the spare energy over a set period, currently calculated weekly) falls below 3%. However, because it requires system modifications, the FAQ on the publication website says its introduction date is “undecided at this time.”
Cumulative Price Threshold Mechanism: A Safety Valve That Lowers the Cap to ¥100/kWh
Raising the cap to ¥300/kWh could place too heavy a burden on retail electricity suppliers if a tight supply-demand balance lasts a long time. As a safety valve, the cumulative price threshold mechanism started on October 1, 2026.
| Item | Content |
|---|---|
| Period | The seven days before the day in question |
| Trigger condition | Periods with a day-ahead market (spot market) area price of ¥200/kWh or more reach a cumulative 30 periods (in the Okinawa area, judged by the imbalance price) |
| After trigger | From the next day, the cap on the scarcity-adjusted imbalance price is lowered to ¥100/kWh (a level based on the measures under the electricity use restriction order) |
| Release | When there are no periods with an area price of ¥100/kWh or more in the preceding seven days |
Periods for which day-ahead market data could not be received from the Japan Electric Power Exchange (JEPX) are treated as ¥200/kWh or more. If one day’s data (48 periods) is missing, the mechanism is triggered.
Curtailment of Renewables and Thermal Plants, and Area-Wide Blackouts
During solar and wind output curtailment
If the grid is in surplus in a period when output curtailment of solar or wind is being carried out, the imbalance price is ¥0/kWh. This ¥0/kWh applies not only to imbalances on the generation side but also to those on the demand side. Even in a period with output curtailment, ¥0/kWh does not apply if the grid is short.
During curtailment of offline generators (former Type III)
Even when output curtailment of solar and other sources is not needed, the output of offline thermal plants and other resources may be reduced from their planned values. This is done on the instruction of the GT&D company, based on the priority dispatch rules (curtailment order), which set the order in which resources reduce output in times of surplus. This is called curtailment of former Type III generators (the term used in the Interim Report). Offline generators are resources that the GT&D company cannot control directly through communication lines. “Type III” was the name for resources other than the Type I and Type II resources procured through balancing capacity tenders until FY2023 (Article 09). After the tenders ended in FY2024, the Interim Report calls them “former Type III.”
Because former Type III generators are offline, it is difficult to know the cost of adjustment right away. For this reason, the lowest downward instruction unit price registered in the cross-regional balancing system is used as the kWh price of downward adjustment. This is close to the thinking behind the normal price.
During an area-wide blackout
An area-wide blackout is a blackout across the entire area served by a major power company. In Japan, in the early hours of September 6, 2018, the Hokkaido Eastern Iburi Earthquake (maximum seismic intensity 7) caused many power plants to stop, and all of Hokkaido lost power.
If an area-wide blackout occurs, the wholesale electricity market is suspended until the network is restored, and market prices from before the blackout are used.
| Time | Imbalance price |
|---|---|
| Day of the blackout | Spot price immediately before the blackout (for each of the 48 periods) |
| From the next day | Average spot price for the week immediately before the blackout (for each of the 48 periods) |
Summary
- Imbalance price calculation falls into five methods: (1) the marginal kWh price, (2) the scarcity-adjusted imbalance price, (3) solar and wind curtailment, (4) curtailment of former Type III generators, and (5) area-wide blackouts
- Normally, (1) applies, reflecting the kWh price of the balancing capacity used to adjust the imbalance. The 5-minute prices are weighted by imbalance volume and averaged to give the price for each period
- When the scarcity pricing index (the cross-regional reserve margin) falls below 10%, (2) is calculated, and the higher of (1) and (2) becomes the price
- The cap from October 2026 is ¥300/kWh, and the price rises sharply below an index of 8%. It is ¥200/kWh at an index of 5% and ¥300/kWh below 3%
- The scarcity-adjusted imbalance price is not only for summer and winter. In the first half of FY2026, it was calculated in some area in more than 6% of all periods in May and in September as well (Article 08)
This article is based on published materials from the Ministry of Economy, Trade and Industry and its Agency for Natural Resources and Energy, the Electricity and Gas Market Surveillance Commission, the Organization for Cross-regional Coordination of Transmission Operators (OCCTO) and other sources. The English translations of figures are by ENERGY ADVISOR and are not official translations. When using this information for decisions, please check the original sources. When we find an error, we correct the article and note the date of the correction.
Sources
- Imbalance Price Information Website, “Frequently Asked Questions on the Central Imbalance Price Calculation System,” 1-2, 1-3, 1-4, 1-5, 1-6, 1-7, 1-9, 2-2, 2-9, 2-11 and 2-12 (updated October 1, 2026) (in Japanese). https://www.imbalanceprices-cs.jp/show/faq/faqInquiry.pdf
- Electricity and Gas Market Surveillance Commission, “Imbalance Pricing System from FY2022 (Interim Report)” (5-minute weighted averaging: 2(2)②; curtailment of former Type III generators: 2(4); parameters C and D and reference to the cross-regional reserve margin: 2(5); kWh scarcity adjustment: 2(6); area-wide blackouts: 2(8); cumulative price threshold mechanism: 2(9)) (in Japanese). https://www.egc.meti.go.jp/activity/emsc_systemsurveillance/pdf/010_03_03.pdf
- Electricity and Gas Market Surveillance Commission, Expert Meeting on System Design and Monitoring, 10th meeting, Material 3-1, “Detailed Design of the Imbalance Pricing System,” p.3 (June 27, 2025) (in Japanese). https://www.egc.meti.go.jp/activity/emsc_systemsurveillance/pdf/010_03_01.pdf
- OCCTO, Study Committee on Regulating and Marginal Supply Capability and Long-Term Supply–Demand Balance Evaluation, 110th meeting, Material 1, “Supply-Demand Operation Based on the Cross-Regional Reserve Margin in Summer FY2025 and Future Direction,” p.24 (old and new price tables) (September 2, 2025) (in Japanese). https://www.occto.or.jp/assets/chousei_110_01.pdf
- OCCTO, Study Committee on Regulating and Marginal Supply Capability and Long-Term Supply–Demand Balance Evaluation, 86th meeting, Material 1, “Upper Limit of Balancing Capacity Procurement Volume,” p.2 (May 29, 2023) (in Japanese). https://www.occto.or.jp/iinkai/chouseiryoku/2023/files/chousei_86_01.pdf
- EGC Secretariat, Network Business Surveillance Division, “On the Imbalance Pricing System and Related Matters” (January 28, 2022; source of the figures in the original post) (in Japanese). https://www.egc.meti.go.jp/info/public/pdf/20220117001b.pdf
- Kansai Electric Power, “Overview of Cross-Regional Balancing” (source of a figure in the original post; could not be opened, returning 403, when accessed on October 22, 2026) (in Japanese). https://www.kepco.co.jp/corporate/pr/souhaiden/2020/pdf/0312_1j_01.pdf