The imbalance pricing system was revised on October 1, 2026. The cap on the scarcity-adjusted imbalance price, which applies when the supply-demand balance is tight, rose from ¥200/kWh to ¥300/kWh, and the “cumulative price threshold mechanism” started. This mechanism temporarily lowers the cap on the scarcity-adjusted imbalance price when day-ahead market prices stay high. On the same day, the intraday market (the market for same-day trading) of the Japan Electric Power Exchange (JEPX) began showing order information by zone.
The imbalance price is the unit price used for settlement when the general transmission and distribution company (GT&D company, which operates the grid in each area) fills the deviation between the plan a company submitted and its actual results (an imbalance) (Article 04). How the review developed and the basis for ¥300 were explained in a separate article, “Raising Japan’s Scarcity Imbalance Price Cap (Parameter C) to ¥300/kWh” (Article 07). This article uses published materials and data to check the new formula and what changes in light of the results in summer 2026.
What Changed on October 1
| Item | Until September 2026 | From October 1, 2026 |
|---|---|---|
| Cap on the scarcity-adjusted imbalance price (parameter C) | ¥200/kWh | ¥300/kWh |
| Price at the kink of the scarcity-adjusted imbalance price (parameter D) | ¥45/kWh | ¥50/kWh |
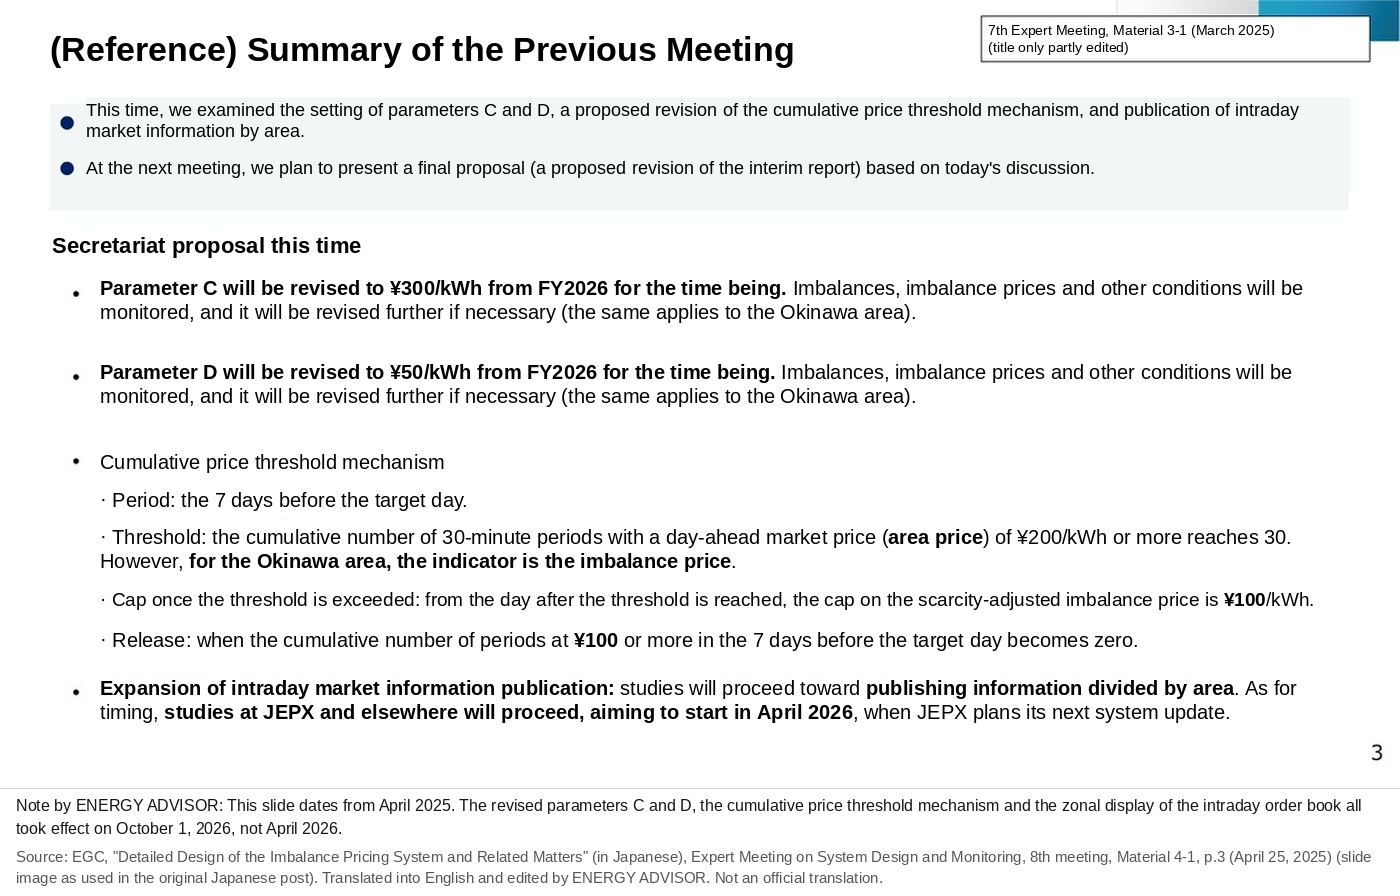
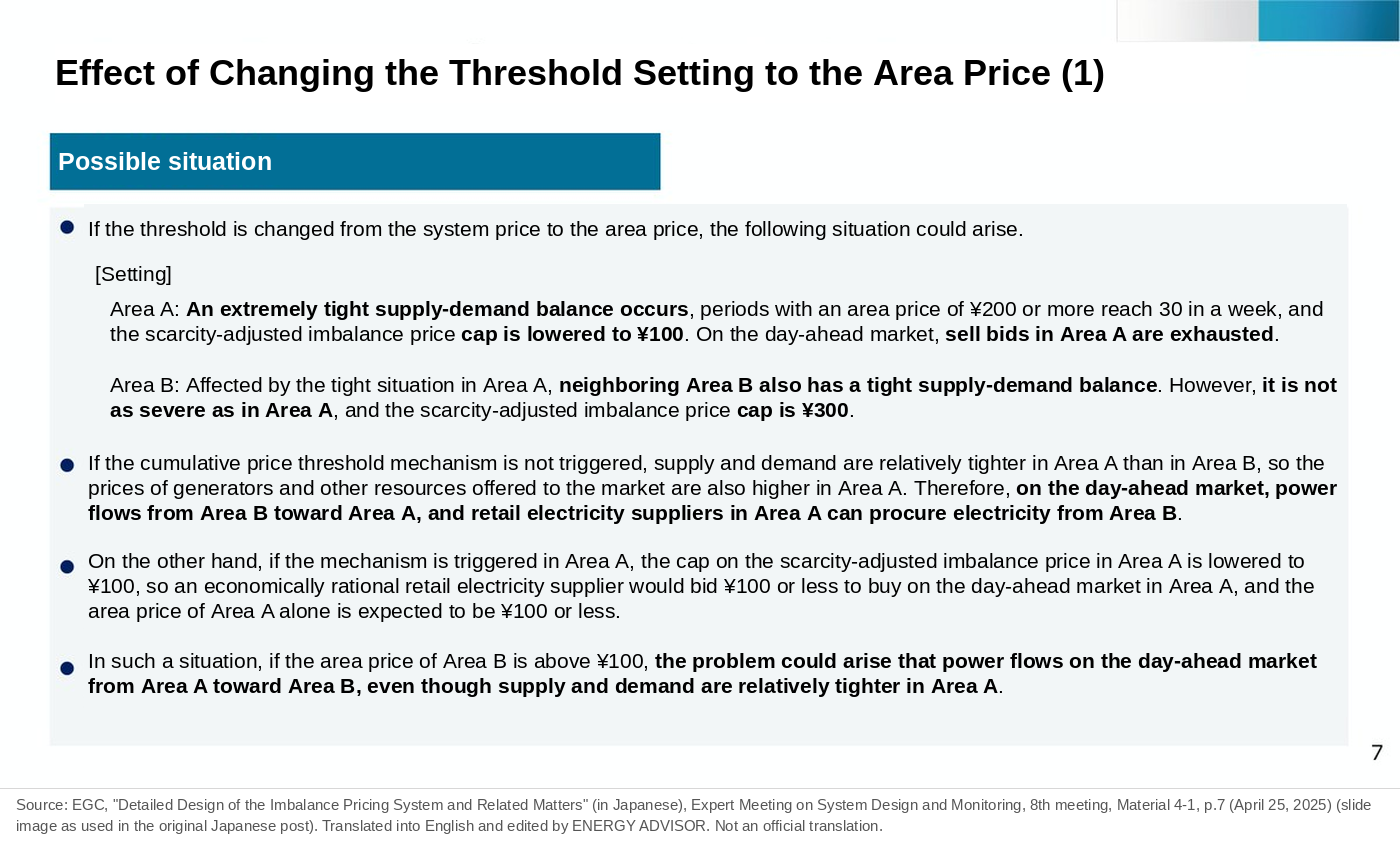
| Cumulative price threshold mechanism | None | If area prices of ¥200/kWh or more reach 30 periods in the preceding seven days, the cap is lowered to ¥100/kWh from the next day |
| Intraday market order information | No area shown | Shown in five zones |
The area price is the price in the JEPX day-ahead market (spot market) that is set separately for each area when interconnection constraints split the market (Article 01).
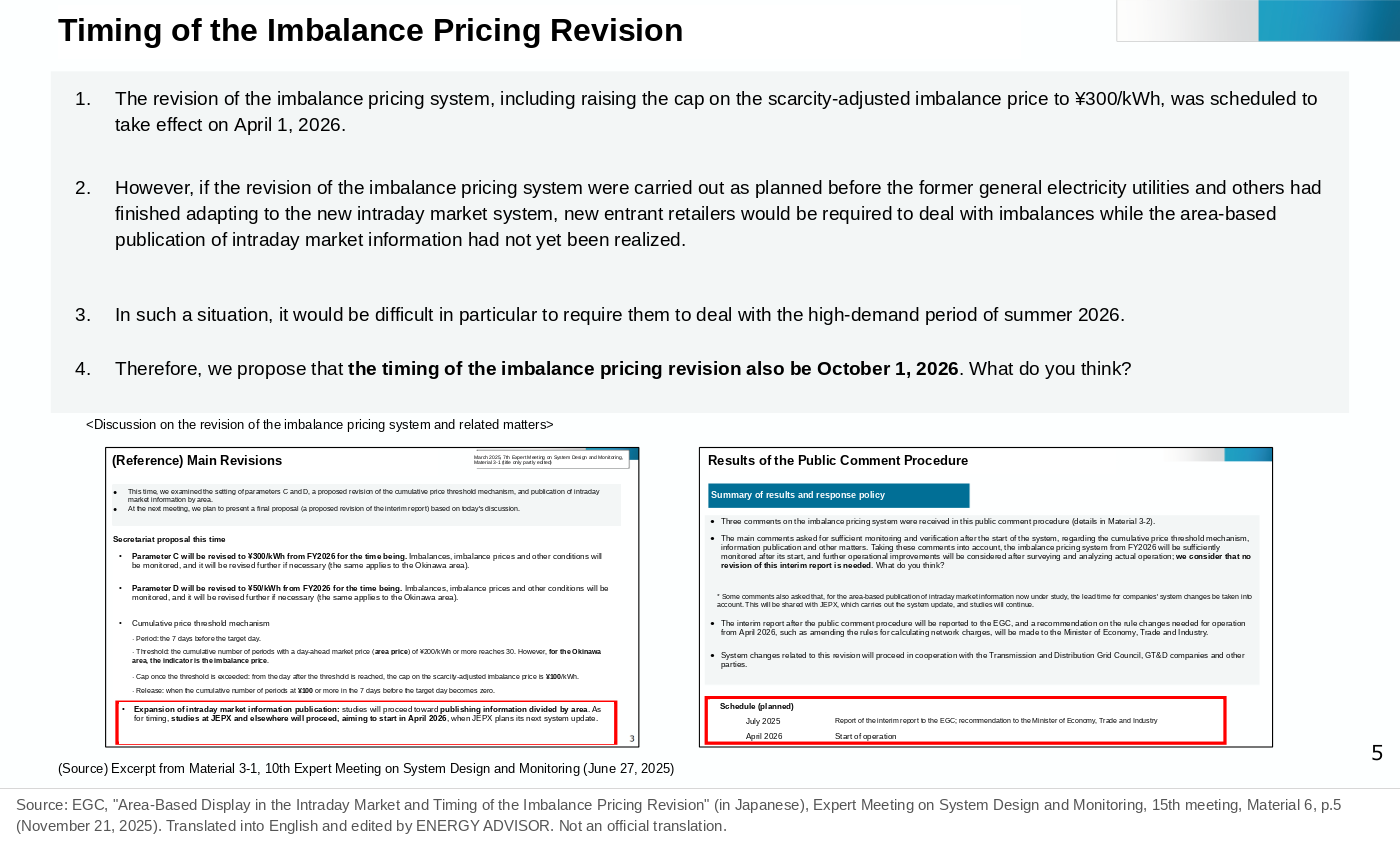
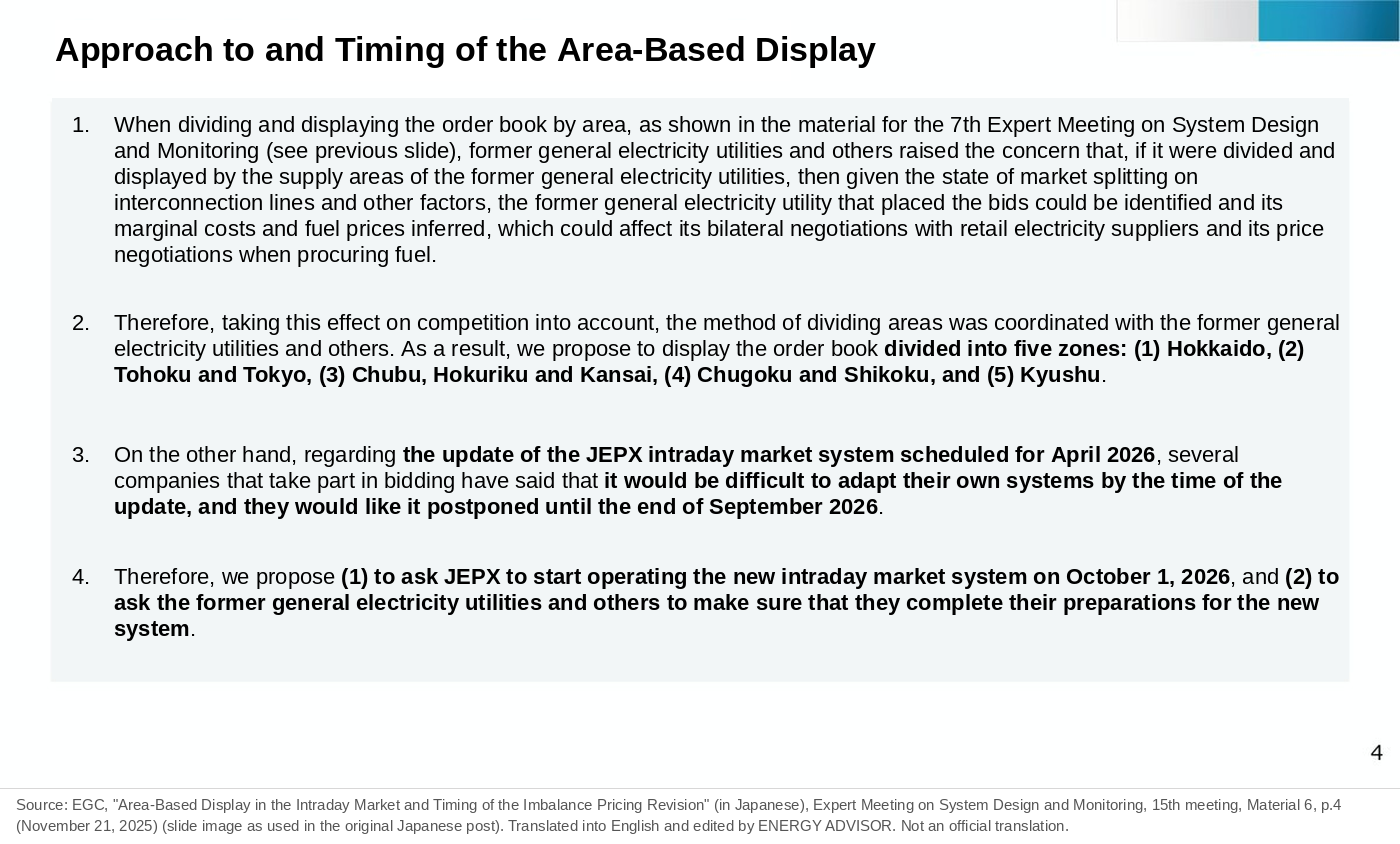
This revision was finalized in June 2025 at the Expert Meeting on System Design and Monitoring of the Electricity and Gas Market Surveillance Commission (EGC), and operation was originally scheduled to start in April 2026. The EGC is a regulator under the Minister of Economy, Trade and Industry that monitors electricity markets and examines the details of pricing rules. Later, companies participating in bidding said it would be difficult to adapt their own systems by the April 2026 upgrade of the intraday market system, and the new intraday market system started operating on October 1. Because it was difficult to require companies to respond to imbalances during the high-demand summer period without the zonal display, it was decided at the 15th meeting in November 2025 that the revision of the imbalance pricing system would also take effect on October 1.
The New Formula
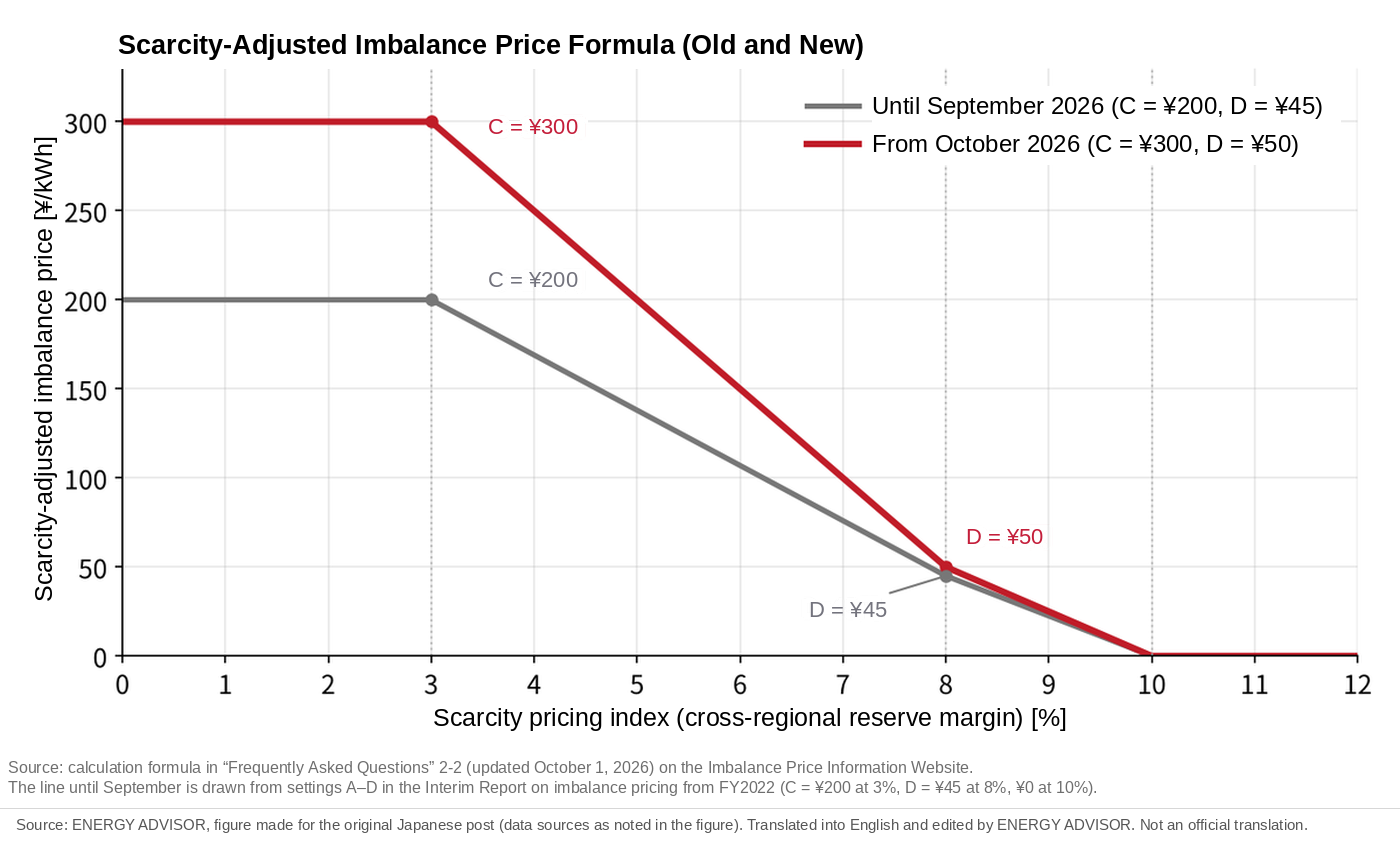
The imbalance price is the higher of the “marginal kWh price of balancing capacity” and the “scarcity-adjusted imbalance price.” The scarcity-adjusted imbalance price is calculated when the scarcity pricing index (the cross-regional reserve margin, in %) falls below 10%, and it rises as the index falls. The cross-regional reserve margin is a ratio, viewed across areas, of how much spare supply capacity there is relative to demand. The mechanism reflects in the price the fact that shortfall imbalances when the supply-demand balance is tight lead to blackout risk and to the cost of securing additional supply capacity.
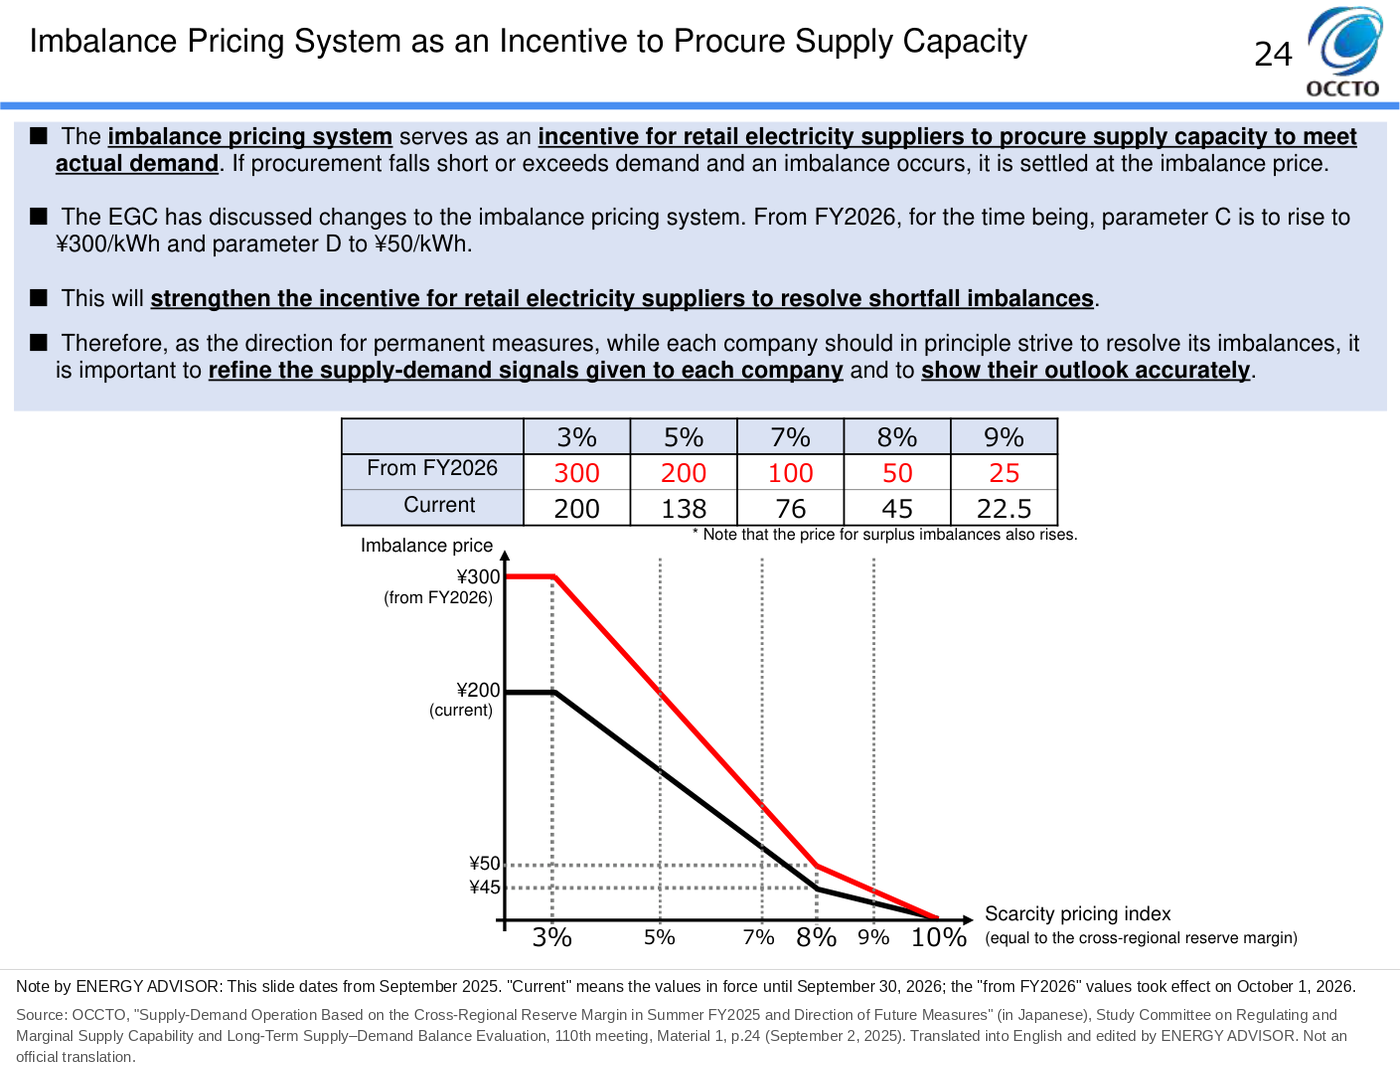
The “Frequently Asked Questions” on the Imbalance Price Information Website were updated on October 1 to show the new prices: ¥50 at an index of 8%, ¥100 at 7%, ¥200 at 5% and ¥300 at 3% or less.
Comparing old and new, what changed is mainly the slope once the index falls below 8%. The range from 8% to below 10% is almost unchanged. At an index of 5%, the price reaches ¥200, the same as the cap before the revision.
Results in the First Half of FY2026
Periods in which the scarcity-adjusted imbalance price was calculated
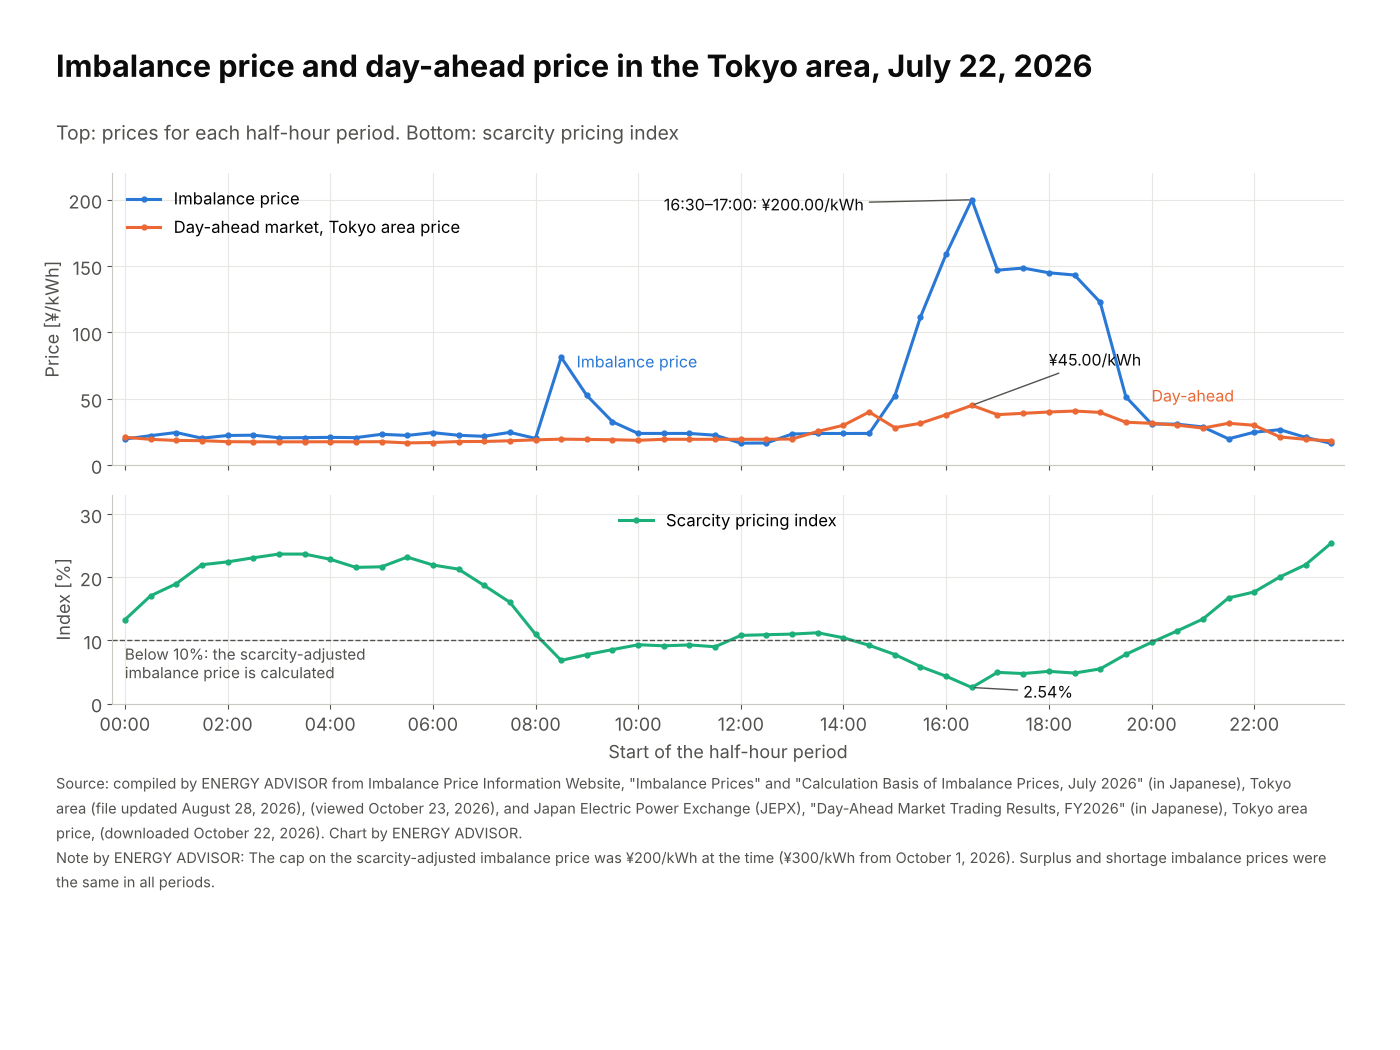
The imbalance price is set for every 30 minutes (one period), and a day has 48 periods. For the first half of FY2026 (April–September 2026), the periods in which the index fell below 10% in at least one of the nine areas were counted from the calculation basis files.
| Month | Total periods | Below 10% (share) | Of which below 8% (share) | Highest scarcity-adjusted imbalance price |
|---|---|---|---|---|
| April | 1,440 | 44 (3.1%) | 7 (0.5%) | ¥137.69/kWh |
| May | 1,488 | 100 (6.7%) | 9 (0.6%) | ¥114.44/kWh |
| June | 1,440 | 49 (3.4%) | 9 (0.6%) | ¥111.65/kWh |
| July | 1,488 | 152 (10.2%) | 36 (2.4%) | ¥200.00/kWh |
| August | 1,488 | 152 (10.2%) | 30 (2.0%) | ¥120.33/kWh |
| September | 1,440 | 95 (6.6%) | 3 (0.2%) | ¥75.38/kWh |
In July and August, the scarcity-adjusted imbalance price was calculated in about one in ten of all periods, and in May and September it was in the 6% range. In periods where the marginal kWh price of balancing capacity is higher, that price becomes the imbalance price.
The Tokyo area on July 22
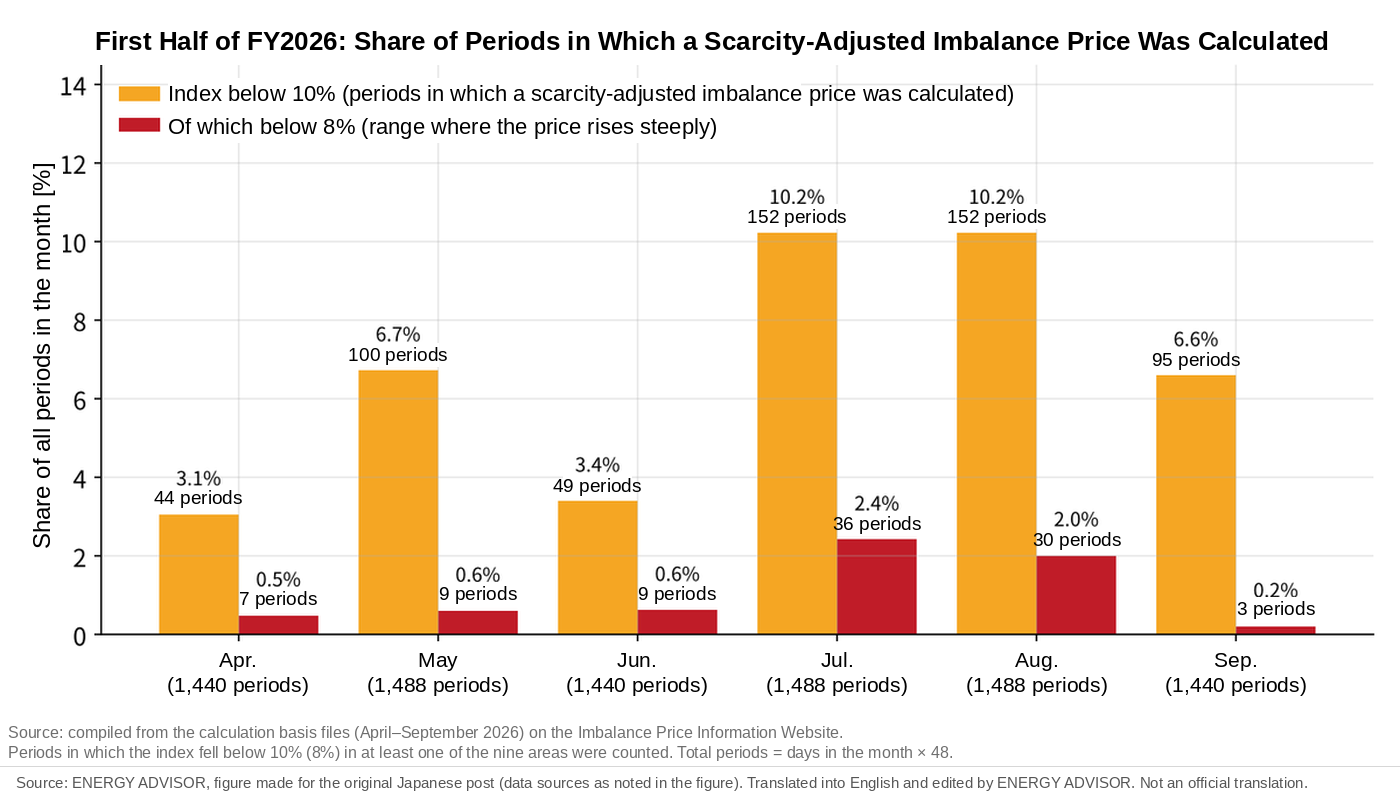
The tightest case in the first half was the Tokyo area on July 22. In the 16:30–17:00 period, the index fell to 2.54%, and the imbalance price reached ¥200/kWh, the cap at the time. The Tokyo area price in the day-ahead market for the same period was ¥45.00/kWh.
Applying the formula from October, as posted in the FAQ, to that day’s index and taking the higher of the result and the marginal kWh price of balancing capacity gives ¥300/kWh for the 16:30 period and around ¥200/kWh for 17:00–19:00 as well.
| Period | Index (%) | Actual imbalance price (¥/kWh) | Under the formula from October (¥/kWh) | Day-ahead, Tokyo (¥/kWh) |
|---|---|---|---|---|
| 15:30–16:00 | 5.85 | 111.65 | 157.50 | 31.52 |
| 16:00–16:30 | 4.32 | 159.08 | 234.00 | 38.00 |
| 16:30–17:00 | 2.54 | 200.00 | 300.00 | 45.00 |
| 17:00–17:30 | 4.94 | 146.93 | 203.00 | 38.00 |
| 17:30–18:00 | 4.75 | 148.53 | 212.50 | 39.00 |
| 18:00–18:30 | 5.10 | 144.97 | 195.00 | 40.00 |
| 18:30–19:00 | 4.83 | 143.27 | 208.50 | 40.72 |
| 19:00–19:30 | 5.49 | 122.81 | 175.50 | 39.70 |
Cumulative Price Threshold Mechanism
Raising the cap to ¥300 could place too heavy a burden on retail electricity suppliers if a tight supply-demand balance lasts a long time. The cumulative price threshold mechanism was created as a safety valve against this.
| Item | Content |
|---|---|
| Period | The seven days before the day in question |
| Trigger condition | Periods with a day-ahead area price of ¥200/kWh or more reach a cumulative 30 periods (in the Okinawa area, judged by the imbalance price) |
| After trigger | From the next day, the cap on the scarcity-adjusted imbalance price is lowered to ¥100/kWh (a level based on the measures under the electricity use restriction order) |
| Release | When there are no periods with an area price of ¥100/kWh or more in the preceding seven days |
Because the judgment is made by area, if the mechanism is triggered only in one area, its day-ahead price could be reversed relative to a neighboring area, and power flow could go from the area with the tighter balance to the area with more headroom. The EGC said such cases would be extremely rare and that system modifications to address them would be excessive, so it took no special measures; if the mechanism is triggered, it will be reviewed afterward.
Since April 2024, there has been no period in the JEPX day-ahead market with an area price of ¥200/kWh or more. On July 22, the Tokyo area’s day-ahead price also peaked at ¥45.00/kWh, so on a day when only the imbalance price rises, the mechanism is not triggered. The FAQ states that periods for which day-ahead market data could not be received from JEPX are treated as ¥200/kWh or more, and if one day’s data (48 periods) is missing, the mechanism is triggered.
Zonal Display of the Intraday Order Book
From October 1, order information in JEPX’s intraday market is shown in five zones: (1) Hokkaido, (2) Tohoku and Tokyo, (3) Chubu, Hokuriku and Kansai, (4) Chugoku and Shikoku, and (5) Kyushu.
Until then, it was not possible to see which area a sell order came from, and when an interconnection line was split, a sell order visible in the order book sometimes could not be cleared. Concerns were raised that nine zones, one for each service area of the former general electricity utilities (incumbent regional utilities: the large power companies that handled everything from generation to retail in each area before liberalization), would reveal which former general electricity utility had placed an order and allow others to infer its marginal cost and fuel prices. After adjustment, five zones were adopted.
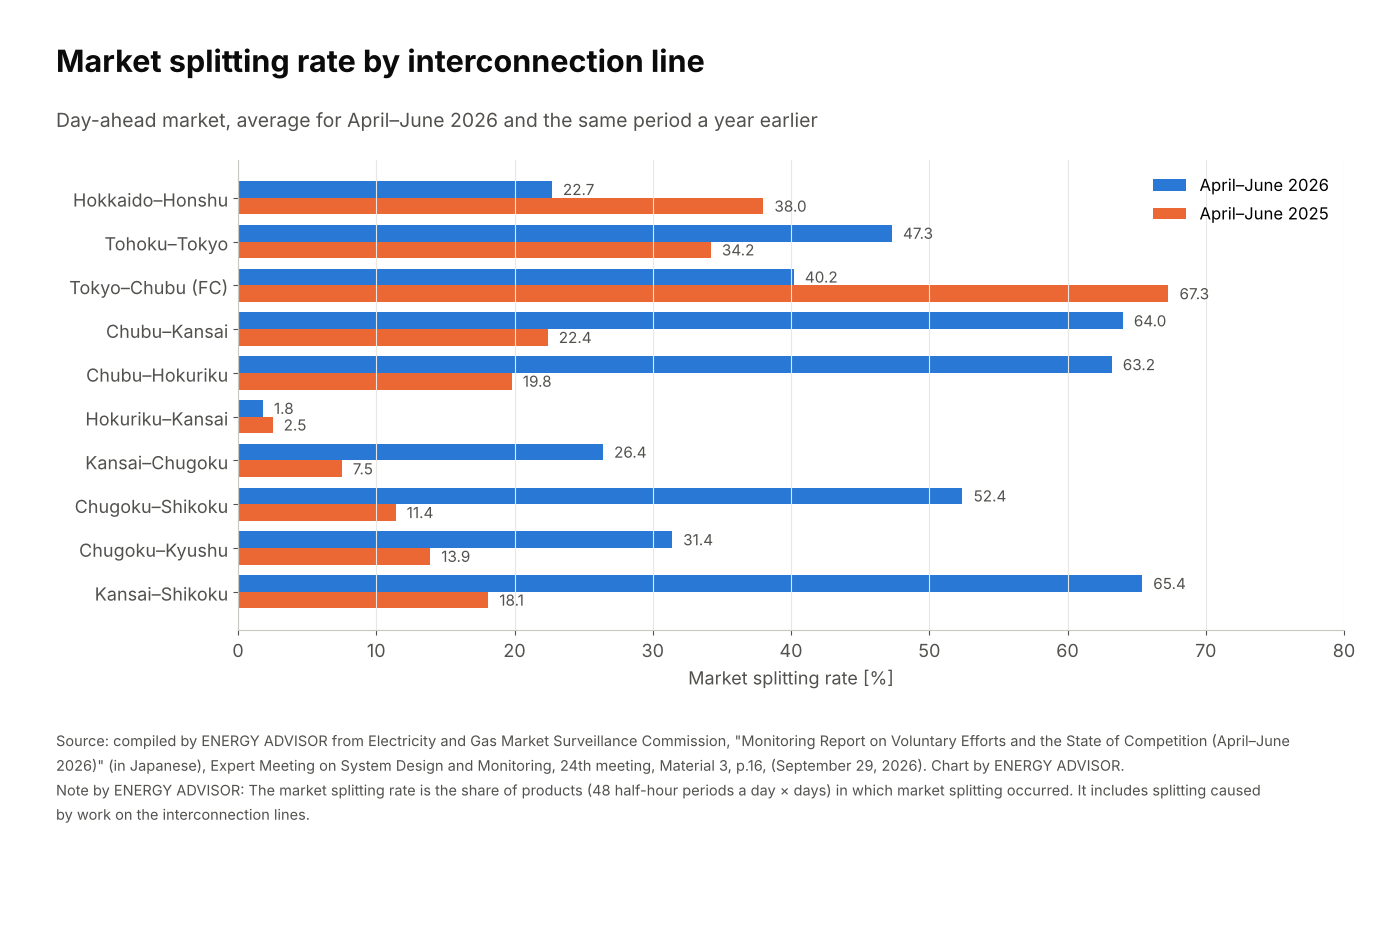
However, even within the “Chubu, Hokuriku and Kansai” zone, the day-ahead market splitting rate in April–June 2026 was 64.0% between Chubu and Kansai and 63.2% between Chubu and Hokuriku. Even within the same zone, orders between Chubu and Hokuriku or Kansai may not be cleared.
Points to Watch in Practice
- When the index falls below 8%, the price rises sharply, reaching ¥200 at 5% and ¥300 at 3% or less
- The scarcity-adjusted imbalance price is not only a summer issue; in FY2026 it was also calculated in more than 6% of all periods in May and September
- Even when spot prices are low, the imbalance price can reach the cap if the reserve margin in real time falls. The risk of shortfall imbalances cannot be estimated from day-ahead procurement prices alone
- In the intraday market, companies can now see sell orders by zone and bid with interconnection splitting in mind
The ¥300 cap applies only to periods with an index of 3% or less. Not only the cap but also the steeper slope below an index of 8% affects day-to-day supply-demand management.
Summary
- From October 1, 2026, the cap on the scarcity-adjusted imbalance price (parameter C) became ¥300/kWh, and parameter D became ¥50/kWh. What changed mainly is the slope in the range where the index is below 8%
- In the first half of FY2026, the scarcity-adjusted imbalance price was calculated for at least one area in about one in ten of all periods in July and August. The Tokyo area on July 22 reached the then cap of ¥200, which would correspond to ¥300 under the formula from October
- The cumulative price threshold mechanism, which lowers the cap to ¥100 when spot prices stay high for a long time, started
- In the intraday market, order information is now shown in five zones
This article is based on published materials from the Ministry of Economy, Trade and Industry and its Agency for Natural Resources and Energy, the Electricity and Gas Market Surveillance Commission, the Organization for Cross-regional Coordination of Transmission Operators (OCCTO) and other sources. The English translations of figures are by ENERGY ADVISOR and are not official translations. When using this information for decisions, please check the original sources. When we find an error, we correct the article and note the date of the correction.
Sources
- Electricity and Gas Market Surveillance Commission, Expert Meeting on System Design and Monitoring, 7th meeting (March 31, 2025), Material 3-1, “Detailed Design of the Imbalance Pricing System” (in Japanese). https://www.egc.meti.go.jp/activity/emsc_systemsurveillance/pdf/007_03_01.pdf
- Same, 8th meeting (April 25, 2025), Material 4-1, “Detailed Design of the Imbalance Pricing System,” pp.3 and 7 (in Japanese). https://www.egc.meti.go.jp/activity/emsc_systemsurveillance/pdf/008_04_01.pdf ; Material 4-2, “Interim Report (Draft Revision)” (in Japanese). https://www.egc.meti.go.jp/activity/emsc_systemsurveillance/pdf/008_04_02.pdf
- Same, 10th meeting (June 27, 2025), Material 3-1, “Detailed Design of the Imbalance Pricing System” (in Japanese). https://www.egc.meti.go.jp/activity/emsc_systemsurveillance/pdf/010_03_01.pdf
- Same, 15th meeting (November 21, 2025), Material 6, “Area-Based Display in the Intraday Market and Timing of the Imbalance Pricing Revision,” p.4 (in Japanese). https://www.egc.meti.go.jp/activity/emsc_systemsurveillance/pdf/015_06_00.pdf
- Same, 24th meeting (September 29, 2026), Material 3, “Monitoring Report on Voluntary Efforts and the State of Competition (April–June 2026),” p.16 (market splitting rates) (in Japanese). https://www.egc.meti.go.jp/activity/emsc_systemsurveillance/pdf/024_03_00.pdf
- Imbalance Price Information Website, “Frequently Asked Questions,” 2-2, 2-11 and 2-12 (updated October 1, 2026) (in Japanese). https://www.imbalanceprices-cs.jp/show/faq/faqInquiry.pdf ; imbalance price and calculation basis files (April–September 2026) (in Japanese). https://www.imbalanceprices-cs.jp/ . The first-half counts and the July 22 table were recounted from the calculation basis files for May, July and September 2026 and confirmed to match (October 22, 2026).
- Japan Electric Power Exchange, day-ahead market trading results (in Japanese). https://www.jepx.jp/electricpower/market-data/spot/ . Trading results data for FY2024, FY2025 and FY2026 (deliveries up to October 22, 2026) were used to confirm that there were zero periods with an area price of ¥200/kWh or more in the nine areas (the highest in the period was ¥105.00/kWh in the Hokkaido area on October 20, 2026) (October 22, 2026). “On the System Upgrade Schedule and Other Matters” (November 26, 2025) (in Japanese). https://www.jepx.jp/system/news/pdf/jepx20251126.pdf