The clearing price in the JEPX day-ahead market (spot market) is set where two curves, one of sell bids and one of buy bids, cross. A graph of these two curves is called a bid curve. This article explains how to use bid curves to understand how prices are set, and how to read the bidding behind price spikes and periods when the price falls to ¥0.01/kWh. How the day-ahead market works is explained in the first article of this series.
Single-Price Auction Mechanism
The day-ahead market divides each day into 48 periods of 30 minutes and trades each period as a separate product. The country is divided into nine areas, excluding Okinawa, and bidders choose which area and which period to trade in.
The day-ahead market is a blind single-price auction. Bidders cannot see other participants’ bids; they choose an area and a period, decide a price and a volume, and submit their bids.
After the bidding closes, the Japan Electric Power Exchange (JEPX) splits all bids into sell bids and buy bids.
- Sell bids are sorted from the lowest price and their volumes are stacked up (the supply curve)
- Buy bids are sorted from the highest price and their volumes are stacked up (the demand curve)
- The price at the point where the two curves cross becomes the clearing price
Bidders trade at the single clearing price set by the crossing point, not at the price they bid. This is why it is called the single-price method.
What a Bid Curve Shows
A bid curve is a graph of sell bids and buy bids, with the bid price (¥/kWh) on the vertical axis and the bid volume (MW) on the horizontal axis.
When spot prices spiked in January 2021, the Electricity and Gas Market Surveillance Commission (EGC) began publishing, from January 22, 2021, the supply and demand curves for the periods with the highest prices on weekday mornings and evenings. The EGC is a regulator under the Minister of Economy, Trade and Industry that monitors electricity markets, among other tasks. Today, JEPX publishes the bid curves for the day-ahead market. Publication has made the relationship between supply capacity and demand visible, and it has become easier than before to analyze what set the clearing price.
Bid curves are produced for all 48 periods. When market splitting occurs between areas (when interconnection lines reach their limits and prices split by area), a curve is also published for each split price.
Where to Find Bid Curves
Bid curves can be viewed on the “Bid Curves” page in the day-ahead market data section of the JEPX website.
- Select the delivery date and the split area to display
- Step forward or back to switch to other periods
- Switch between graph, table and data download
- Select a fiscal year to display past data
On the old website used in 2022 (jepx.org), past data could be obtained by changing the year and month in the file URL. Since the website moved to jepx.jp, this method no longer works.
Reading a Bid Curve (1): The Crossing Point and a Vertical Supply Curve
Figure 1 shows the bid curve for the system price (the price for the nine areas combined) for the 18:30–19:00 period on Friday, June 24, 2022.
- The red line is the supply curve. Sell bids are stacked from the lowest sell price
- The blue line is the demand curve. Buy bids are stacked from the highest buy price
The two curves cross at about ¥40/kWh and around 35,000 MW. Almost no sell bids remain to the right of the crossing point, which shows that supply capacity was on the short side and the sell bids were close to being exhausted.
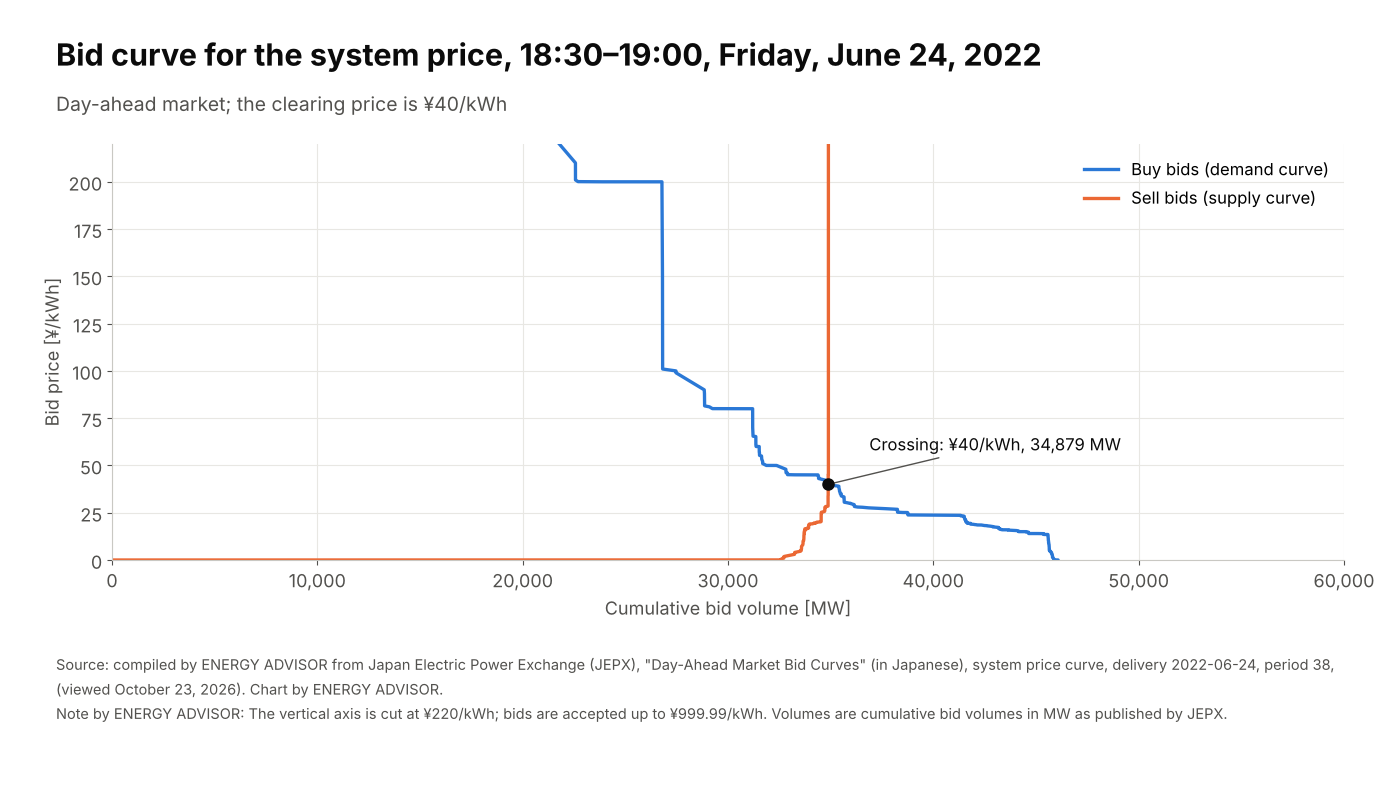
When the supply curve rises vertically at the crossing point, there are no more sell bids; in other words, the sell bids have been exhausted. In this case, the clearing price is set by the price of the buy bids, regardless of the price of the sell bids. The more buy bids there are at high prices, the higher the clearing price. Most bid curves at times of spot price spikes have this shape.
Reading a Bid Curve (2): ¥0.01 Sell Bids and Very High Buy Bids
Sell bids at ¥0.01/kWh
Under the single-price method, supply capacity that the seller wants to be sure of selling is bid at the minimum price of ¥0.01/kWh, and the seller actually receives the clearing price.
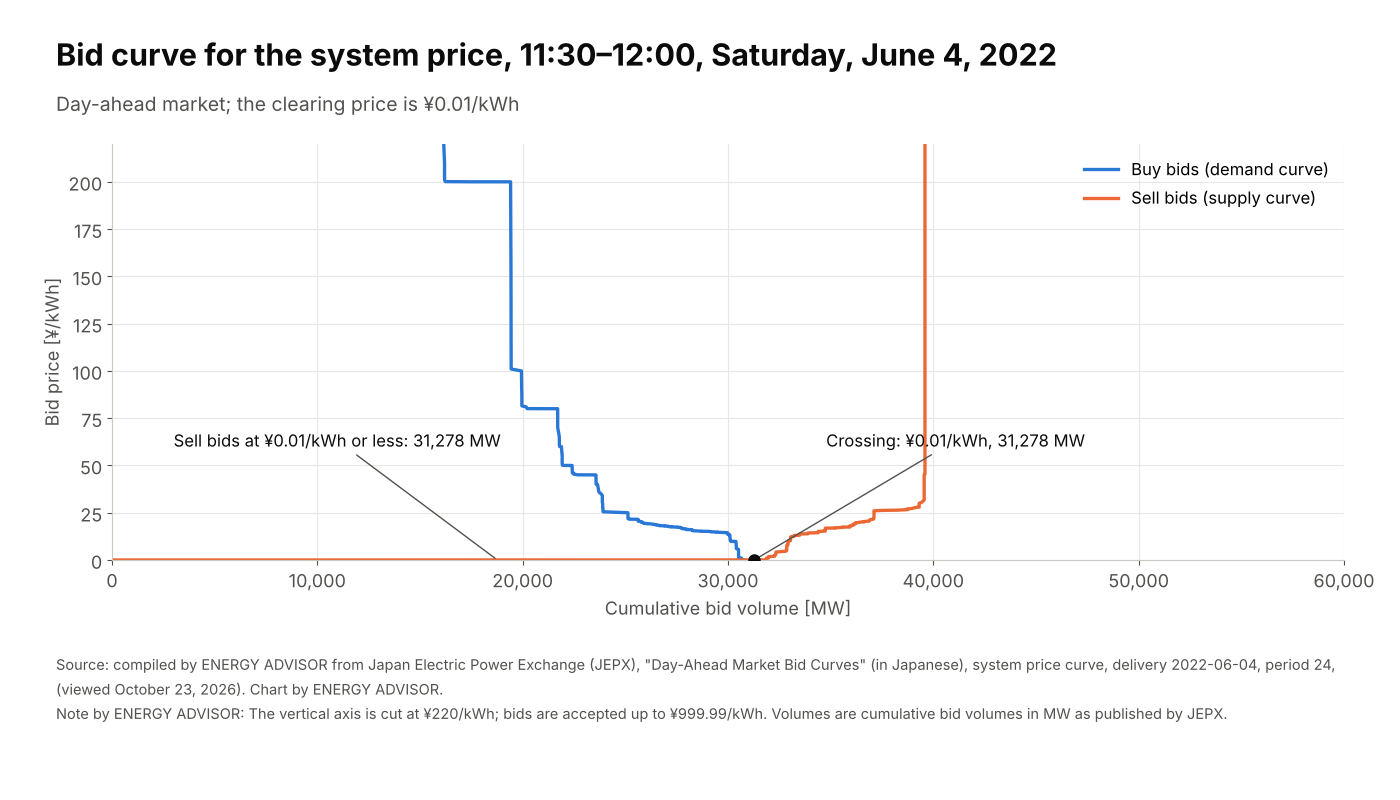
FIT generation is generation covered by the Feed-in Tariff (FIT) scheme. The part of it purchased by the general transmission and distribution companies (GT&D companies, which operate the grid in each area) is offered in the day-ahead market at ¥0.01/kWh. For this reason, during hours on low-demand holidays when solar output is high, the clearing price can fall to ¥0.01/kWh.
Figure 2 shows the bid curve for 11:30–12:00 on Saturday, June 4, 2022. A large volume of sell bids at ¥0.01/kWh from FIT solar makes the two curves cross in the ¥0.01/kWh price range.
Buy bids at ¥200/kWh or more
Supply capacity that must be bought is bid at very high prices (for example, ¥200/kWh or more), because the actual trade takes place at the clearing price. However, when supply capacity is exhausted and many companies bid at high prices, the clearing price itself can rise to levels such as ¥200/kWh.
Case Study: The Price Spike of June 29, 2022
Figure 3 shows the bid curve for the 18:30–19:00 period on Wednesday, June 29, 2022. In this period, the spot price (system price) reached ¥100/kWh, the highest price at the time in the period from April to October 2022.
The crossing point is at ¥100/kWh, and the supply curve (red) rises vertically at the crossing point. This is an example where supply capacity was exhausted and the clearing price was set by the price of the buy bids.
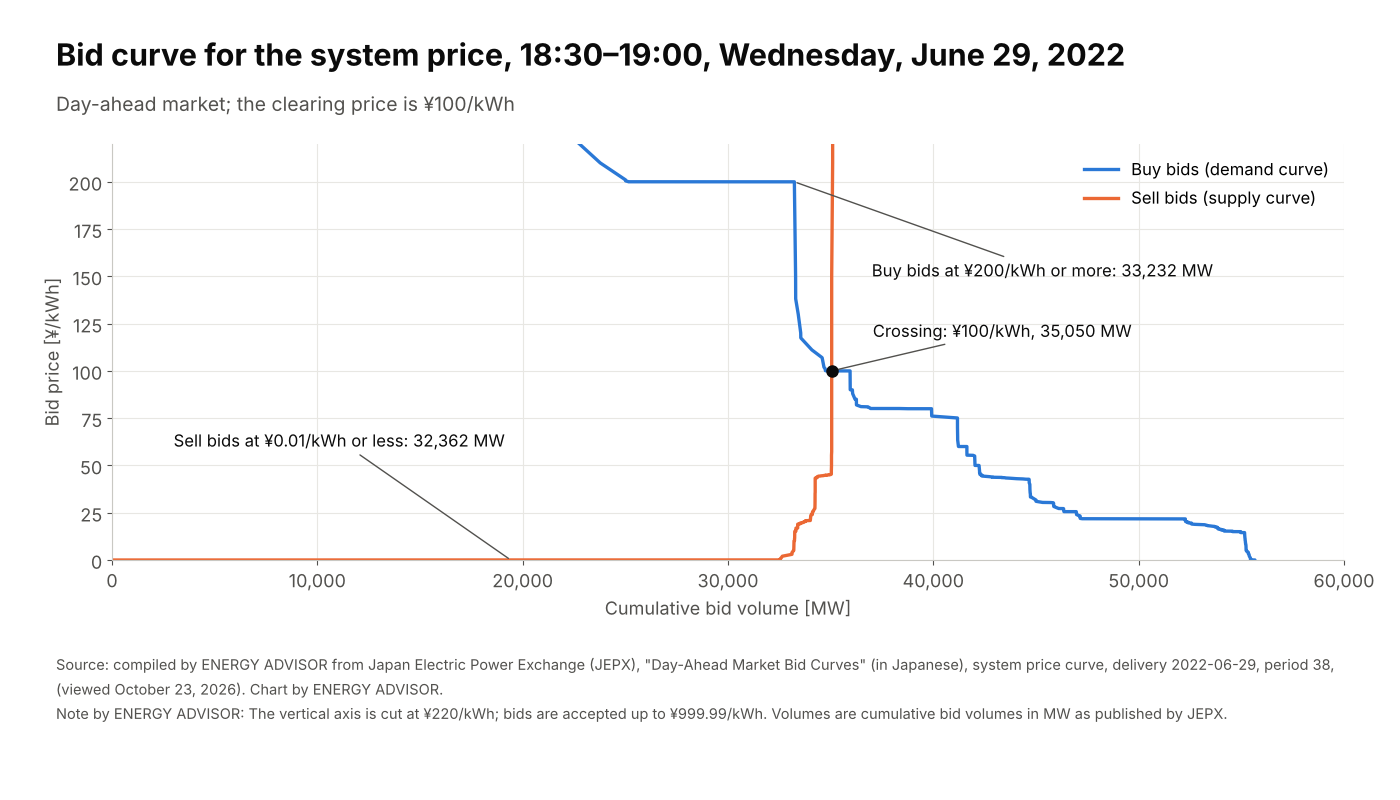
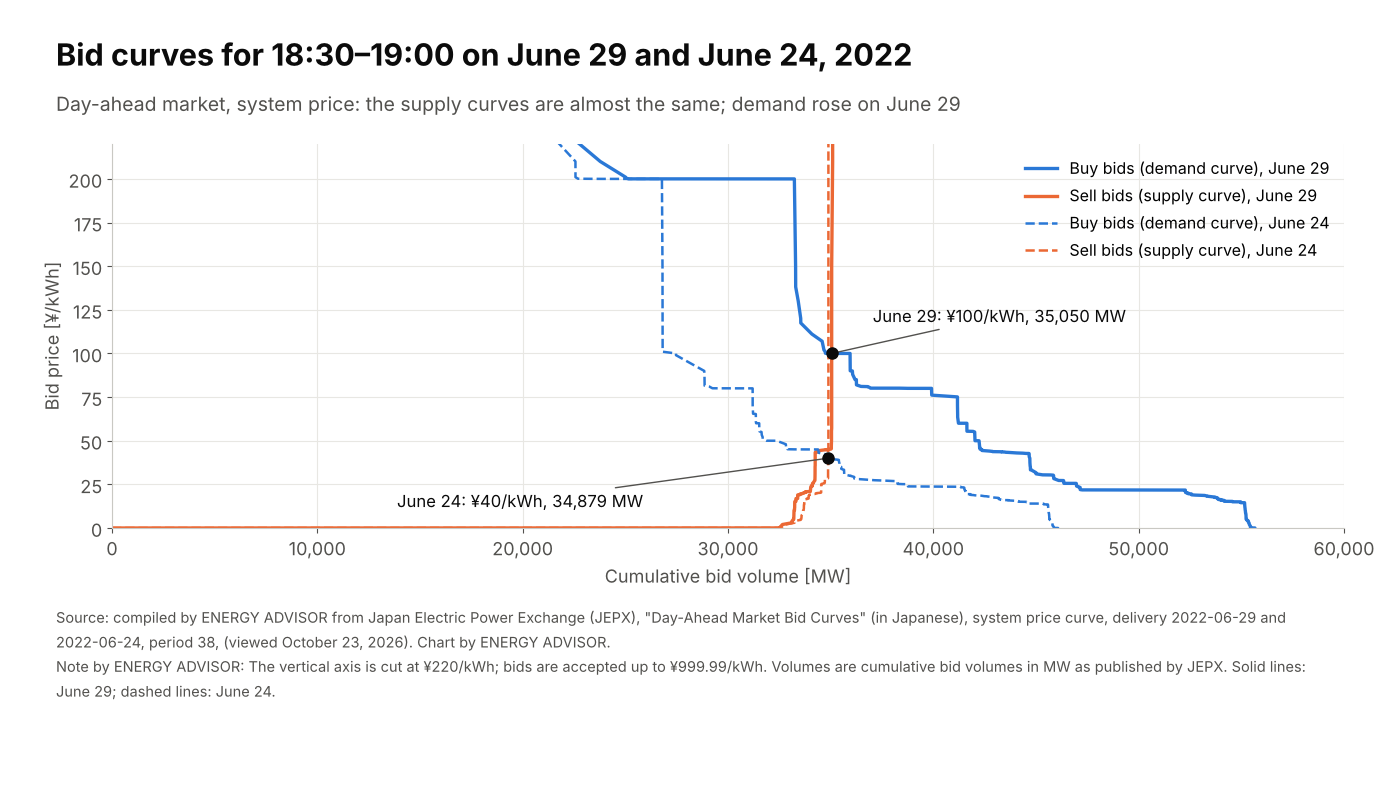
Figure 4 overlays the curve for June 29 and the curve for the same period five days earlier, on Friday, June 24. On June 29, demand surged because of unseasonable extreme heat. The supply curves on the two days are almost the same, which shows that only demand increased while supply capacity did not, and that the price spiked as a result.
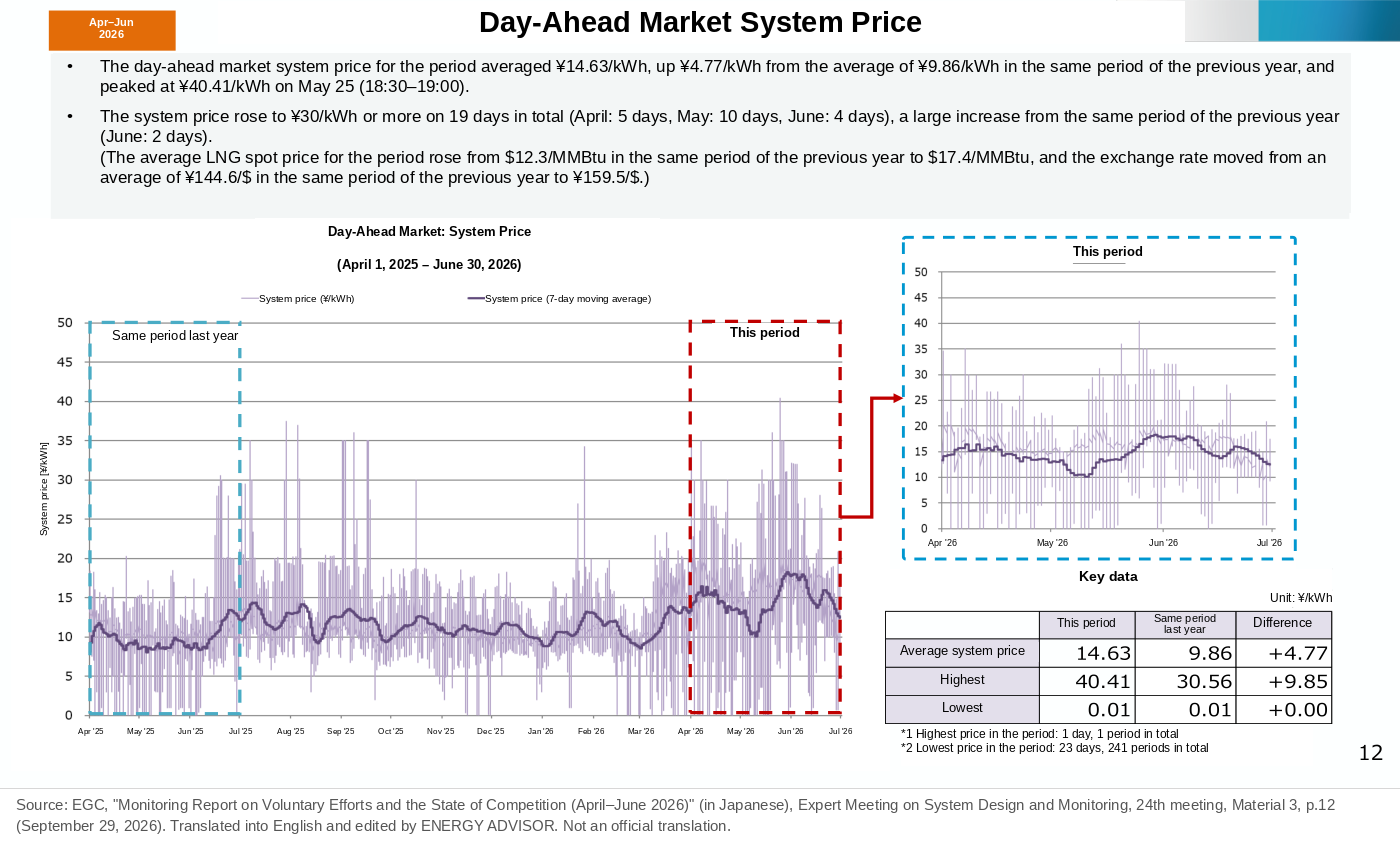
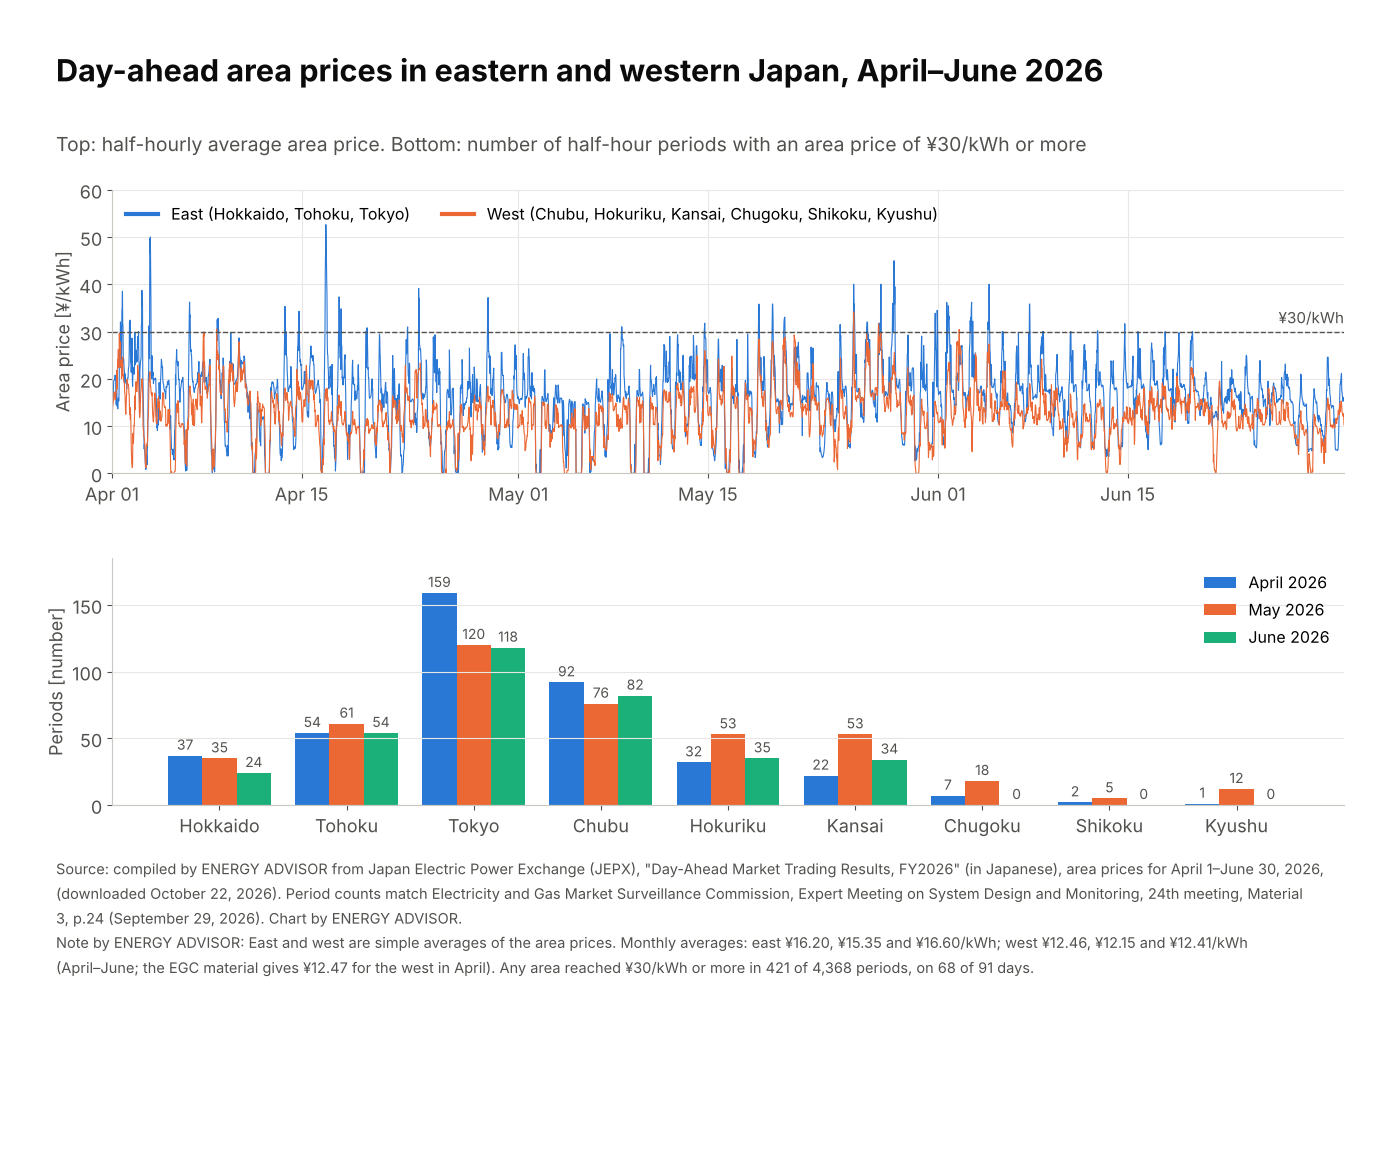
For comparison, here are recent values. In April–June 2026, the highest system price was ¥40.41/kWh, in the 18:30–19:00 period on May 25. Among area prices, the highest was ¥64.28/kWh in the Tokyo area in the 18:30–19:00 period on April 28. In the same quarter, there were 241 periods on 23 days with a price of ¥0.01/kWh.
End of Gross Bidding and the Change in Sell Bids
The former general electricity utilities (incumbent regional utilities) are the large power companies that handled everything from generation to retail in each area before liberalization. In 2022, when the original post was written, the former general electricity utilities passed a fixed share of the electricity transferred from their in-house generation divisions to their retail divisions through the day-ahead market. This is called gross bidding. Some bids were placed so that they would be sure to clear: the generation division sold at ¥0.01/kWh and the retail division bought at a high price.
Gross bidding started in April 2017, with the aim of improving market liquidity, reducing price volatility and improving transparency. It then developed as follows.
| Date | Event |
|---|---|
| April 2017 | Gross bidding introduced |
| October 2023 | Suspended for the time being, because the expected effects had been seen to some extent and non-discriminatory wholesale had improved the transparency of internal transactions |
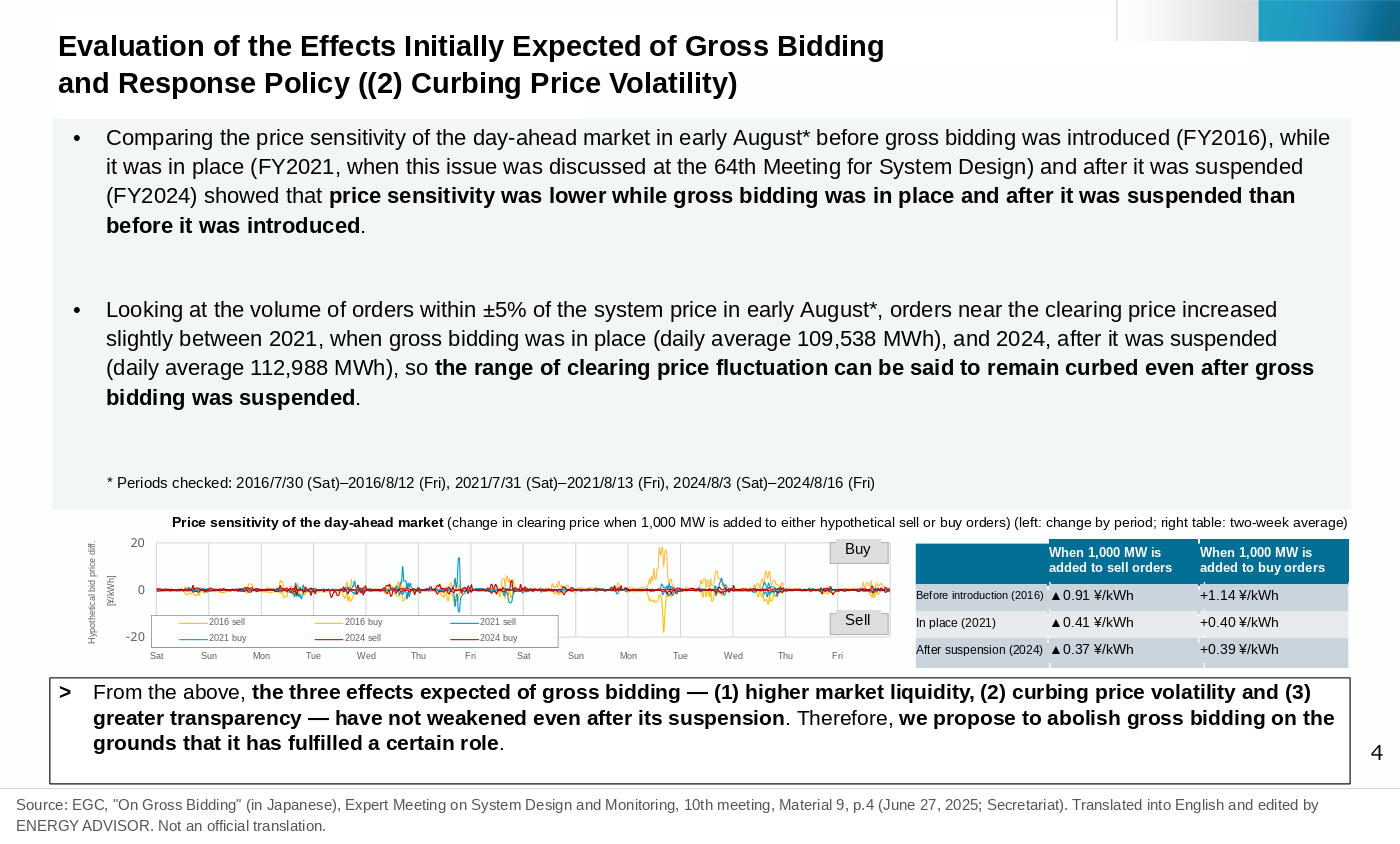
| June 27, 2025 | Abolition decided, on the grounds that the three effects had not decreased after the suspension (EGC, Expert Meeting on System Design and Monitoring, 10th meeting) |
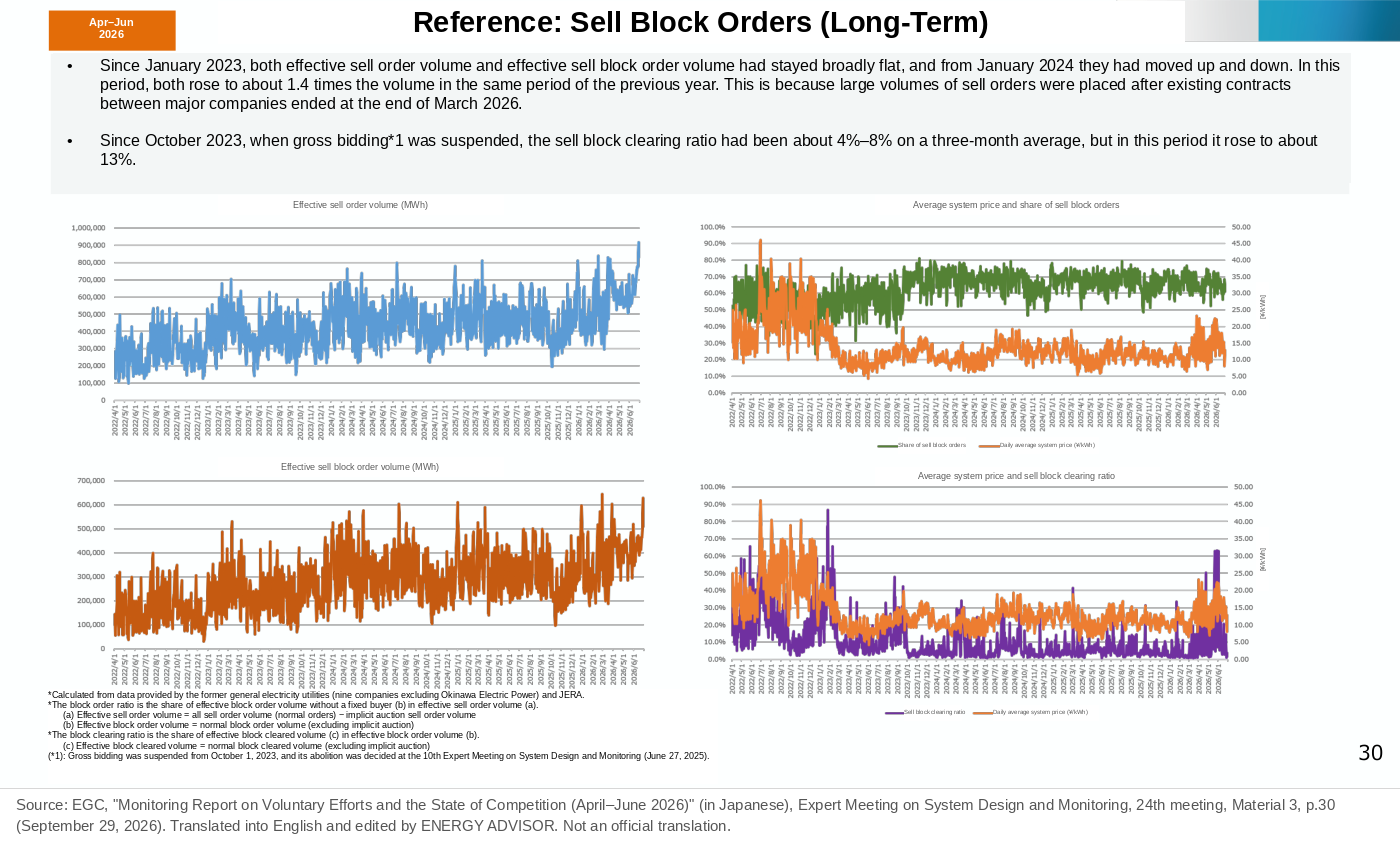
With the suspension, some companies changed how they placed sell block orders (orders that clear several periods together). Bids that had been placed at ¥0.01/kWh were changed to be placed at marginal cost (the cost of generating one more kWh). As a result, the clearing ratio of sell block orders fell. From October 2023 onward, it stayed at about 4–8% on a three-month average. In April–June 2026, it was about 13%.
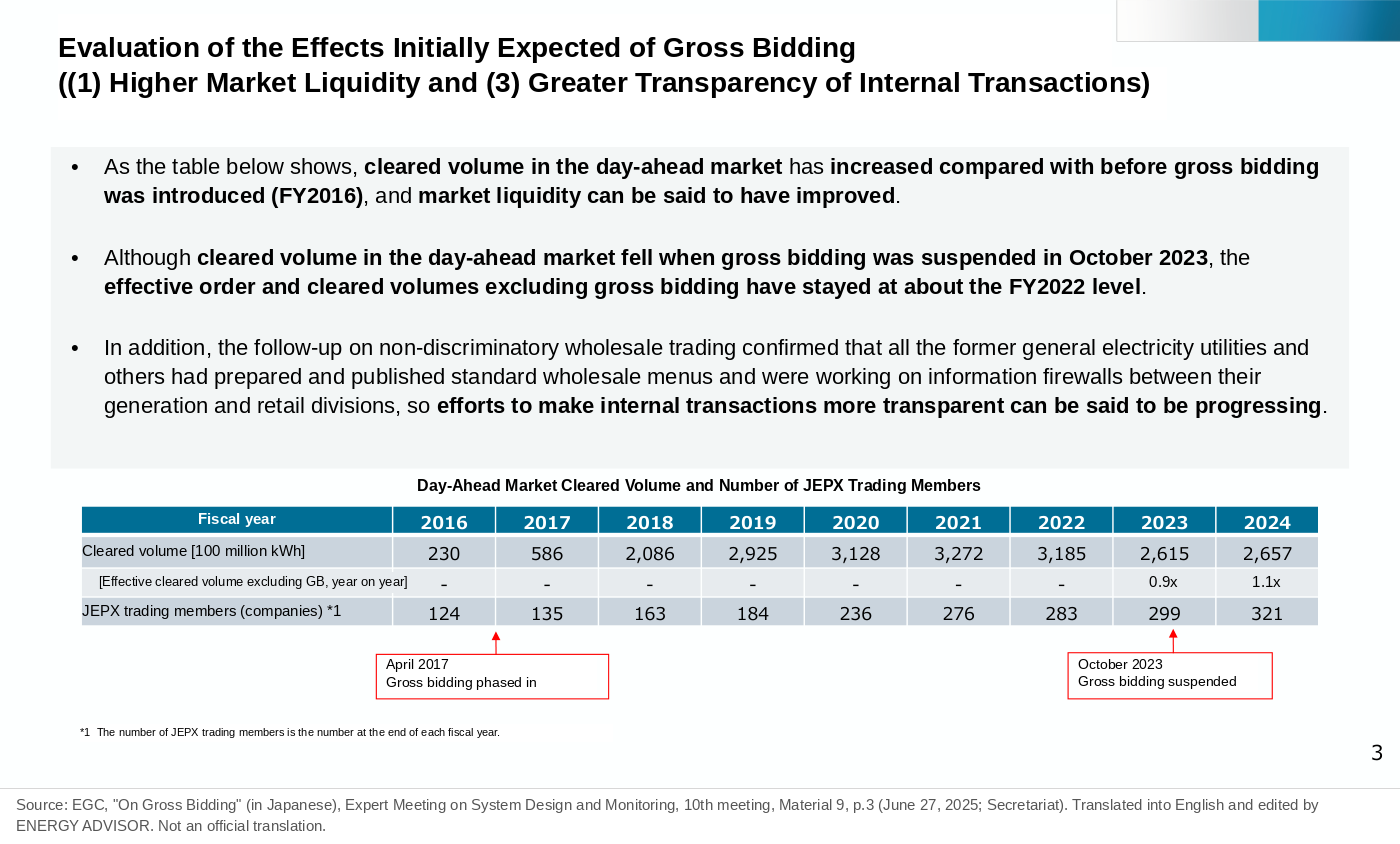
Cleared volume in the day-ahead market fell with the suspension.
| Fiscal year | Day-ahead market cleared volume (TWh) |
|---|---|
| FY2016 (before introduction) | 23.0 |
| FY2022 (in operation) | 318.5 |
| FY2023 (suspended in October) | 261.5 |
| FY2024 (after suspension) | 265.7 |
Japan’s fiscal year runs from April to March; for example, FY2022 is April 2022–March 2023.
On the other hand, the EGC says that the actual bid and cleared volumes excluding gross bidding have stayed at about the same level as in FY2022. The year-on-year ratio of actual cleared volume was 0.9 in FY2023 and 1.1 in FY2024. The EGC concluded that the three effects of improved liquidity, reduced price volatility and improved transparency have not decreased after the suspension.
Summary
- The clearing price in the day-ahead market is set where the supply curve (red), with sell bids stacked from the lowest price, crosses the demand curve (blue), with buy bids stacked from the highest price
- Bid curves can be viewed on the “Bid Curves” page in the day-ahead market data section of jepx.jp, by selecting the date, period and split area
- When the supply curve rises vertically at the crossing point, sell bids are exhausted and the clearing price is set by the price of the buy bids. This is the typical shape during price spikes
- A clearing price of ¥0.01/kWh occurs when ¥0.01 sell bids, such as FIT electricity purchased by GT&D companies, exceed demand
- Gross bidding was suspended in October 2023, and its abolition was decided in June 2025. Day-ahead cleared volume fell, but the actual cleared volume excluding gross bidding is at about the same level as in FY2022
This article is based on published materials from the Ministry of Economy, Trade and Industry and its Agency for Natural Resources and Energy, the Electricity and Gas Market Surveillance Commission, the Organization for Cross-regional Coordination of Transmission Operators (OCCTO) and other sources. The English translations of figures are by ENERGY ADVISOR and are not official translations. When using this information for decisions, please check the original sources. When we find an error, we correct the article and note the date of the correction.
Sources
- Japan Electric Power Exchange, “Bid Curves” (day-ahead market data) (in Japanese; viewed October 22, 2026). https://www.jepx.jp/electricpower/market-data/spot/bid_curves.html
- Electricity and Gas Market Surveillance Commission, Expert Meeting on System Design and Monitoring, 10th meeting, Material 9, “On Gross Bidding,” pp.2–5 (cleared volume trend on p.3) (June 27, 2025) (in Japanese). https://www.egc.meti.go.jp/activity/emsc_systemsurveillance/pdf/010_09_00.pdf
- Electricity and Gas Market Surveillance Commission, Expert Meeting on System Design and Monitoring, 24th meeting, Material 3, “Monitoring Report on Voluntary Efforts and the State of Competition (April–June 2026),” p.12 (highest system price and ¥0.01 periods), p.24 (highest area price) and p.30 (long-term trend of the sell block order clearing ratio) (September 29, 2026) (in Japanese). https://www.egc.meti.go.jp/activity/emsc_systemsurveillance/pdf/024_03_00.pdf
- Electricity and Gas Market Surveillance Commission, “Publication of Supply and Demand Curves in the Wholesale Electricity Market (Spot Market) (Related to Market Price Spikes)” (January 22, 2021) (in Japanese). https://www.egc.meti.go.jp/info/public/news/20210122001.html
- Japan Electric Power Exchange, day-ahead market trading results (bid curves for June 4, 24 and 29, 2022; source of the figures in the original posts) (in Japanese). https://www.jepx.jp/electricpower/market-data/spot/ . The FY2022 trading results data (spot_2022.csv) were used to confirm that the price was ¥0.01/kWh for 11:30–12:00 on June 4, ¥40.00/kWh for 18:30–19:00 on June 24, and ¥100.00/kWh for 18:30–19:00 on June 29 (the highest in FY2022) (checked October 22, 2026).