Prices in the JEPX day-ahead market (spot market) change greatly by season and time of day. This article explains seasonal price patterns through three factors that move prices: demand, solar output and maintenance outages at power plants. How the day-ahead market works is explained in the first article of this series.
Three Factors That Move Spot Prices
The Japan Electric Power Exchange (JEPX) is Japan’s only wholesale power exchange. Its main traders are power generation companies (mainly the former general electricity utilities, that is, the large power companies from before liberalization) and retail electricity suppliers. JEPX’s members and types of markets are explained in Article 01.
As with other goods, the price of electricity is set by the balance of demand and supply.
- Demand: When demand rises, spot prices rise
- Solar output: In hours when solar output is high, spot prices fall
- Supply capacity: When supply capacity falls, for example because power plants are shut down, spot prices rise
Demand is closely related to temperature and changes greatly, mainly with the use of air conditioning and heating. Summer and winter are the seasons when demand rises. On holidays, when businesses are closed, demand is relatively low. Demand also changes greatly within a day: it increases from the morning and peaks from daytime into the night. A graph of how demand changes over a day is called a daily load curve, and its shape changes with the season.
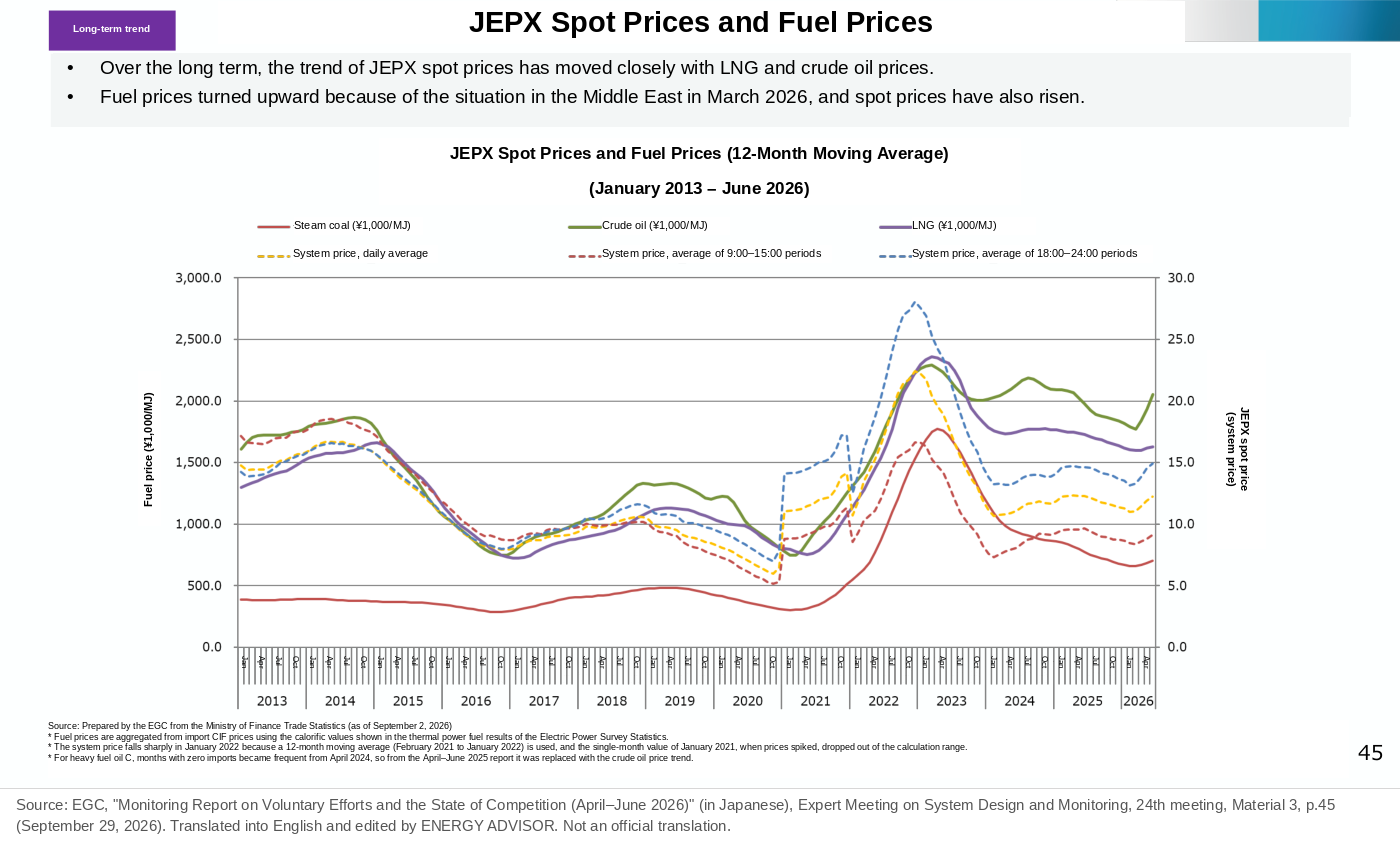
Supply capacity is determined by the number and capability of generators. Fuel prices also affect spot prices.
The characteristics of demand by season are as follows.
| Season | Characteristics of demand | Hours when prices tend to rise |
|---|---|---|
| Summer | Peaks in the afternoon, when temperatures are high (mainly cooling) | From evening into night |
| Winter | High overall from morning to evening because of heating | Throughout the day |
| Spring and autumn | Relatively low, with no cooling or heating demand | Can rise when maintenance outages overlap |
Summer: Solar Matching Demand, and the Evening Rise
The general transmission and distribution companies (GT&D companies) operate the grid in each area. Solar electricity purchased by GT&D companies under the Feed-in Tariff (FIT) scheme is offered in the day-ahead market at the minimum price of ¥0.01/kWh. For this reason, spot prices tend to be low in hours when solar output is high. Generation under the Feed-in Premium (FIP) scheme (a scheme that adds a set subsidy to the price obtained by selling in the market) is sold by the generation company itself, in the wholesale market or elsewhere. So not all renewable electricity is bid at ¥0.01.
In summer, the hours when demand rises overlap with the hours when solar output is high. When demand is high in extreme heat, the weather is sunny, so solar output is also high. Output increases along with demand.
However, solar output falls to zero from evening into night. For this reason, summer spot prices tend to rise from evening into night.
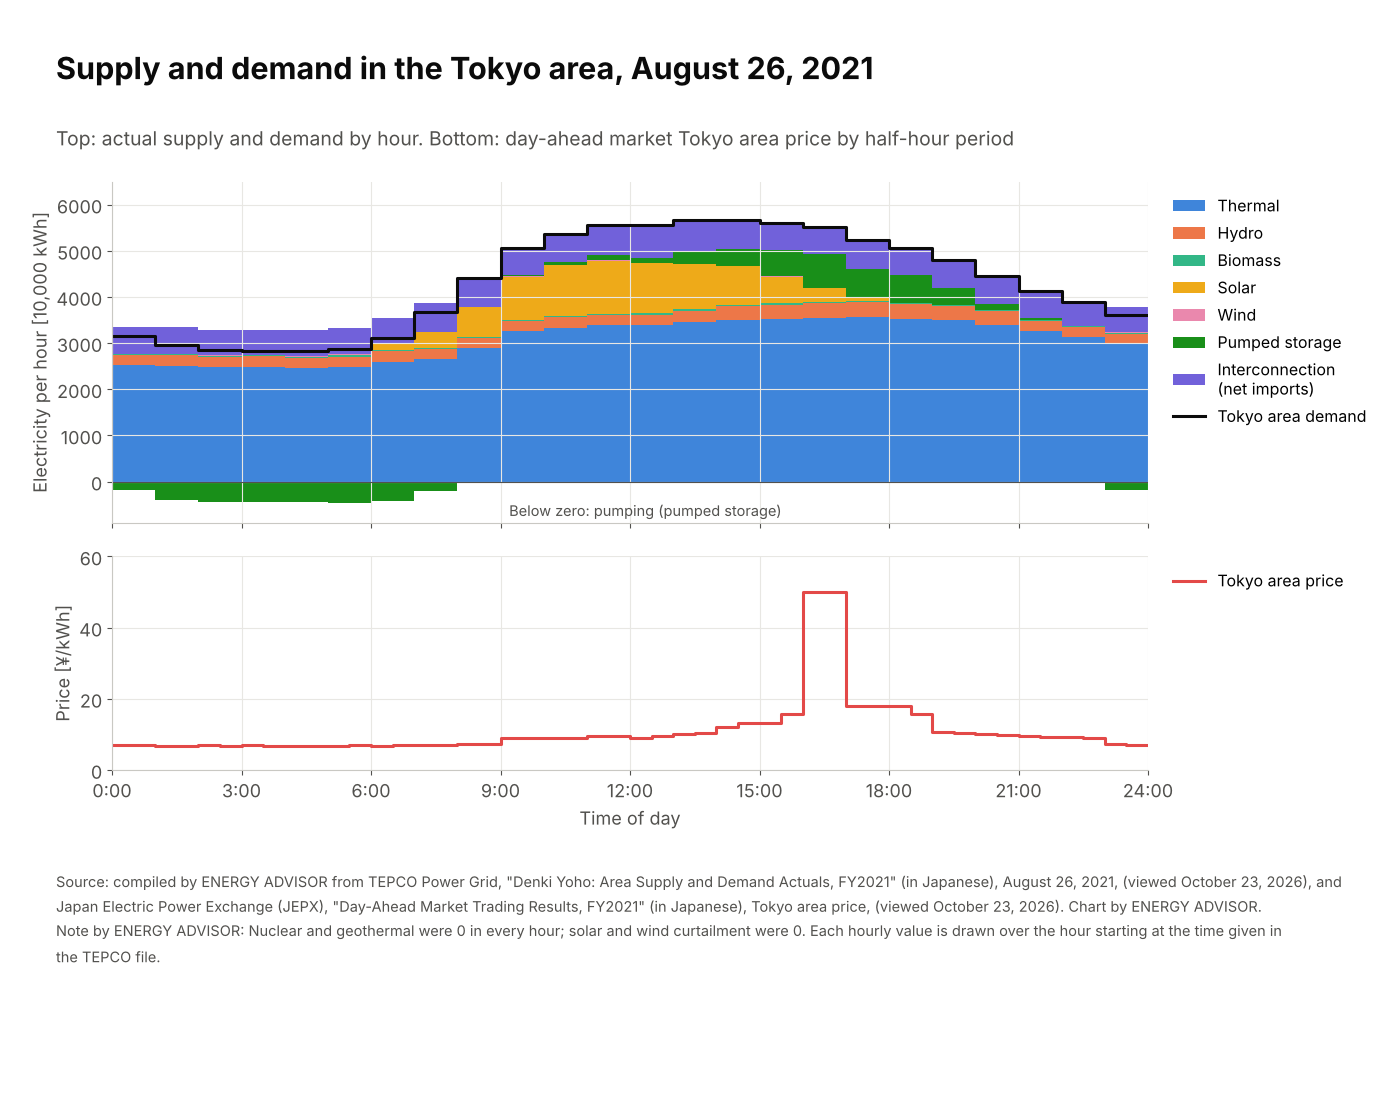
Figure 1 shows, as a past typical example, actual supply and demand in the Tokyo area on August 26, 2021. Looking at solar (yellow) and pumped-storage hydropower (light blue), there is no need to use pumped storage during the day because solar is available, and pumped storage starts to be used in place of solar from the evening. Pumped-storage hydropower is hydropower that pumps water up to an upper reservoir when electricity is in surplus and releases it to generate when electricity is short.
Winter: All-Day Rises in Bad Weather
In winter, solar output is low on days when demand rises. When snow or cloud lowers the temperature, demand stays high from morning to night because of heating. But in snow or cloud, solar cannot generate enough, so thermal power plants and other sources must supply in its place.
For this reason, on snowy or cloudy winter days, spot prices tend to rise from morning to night.
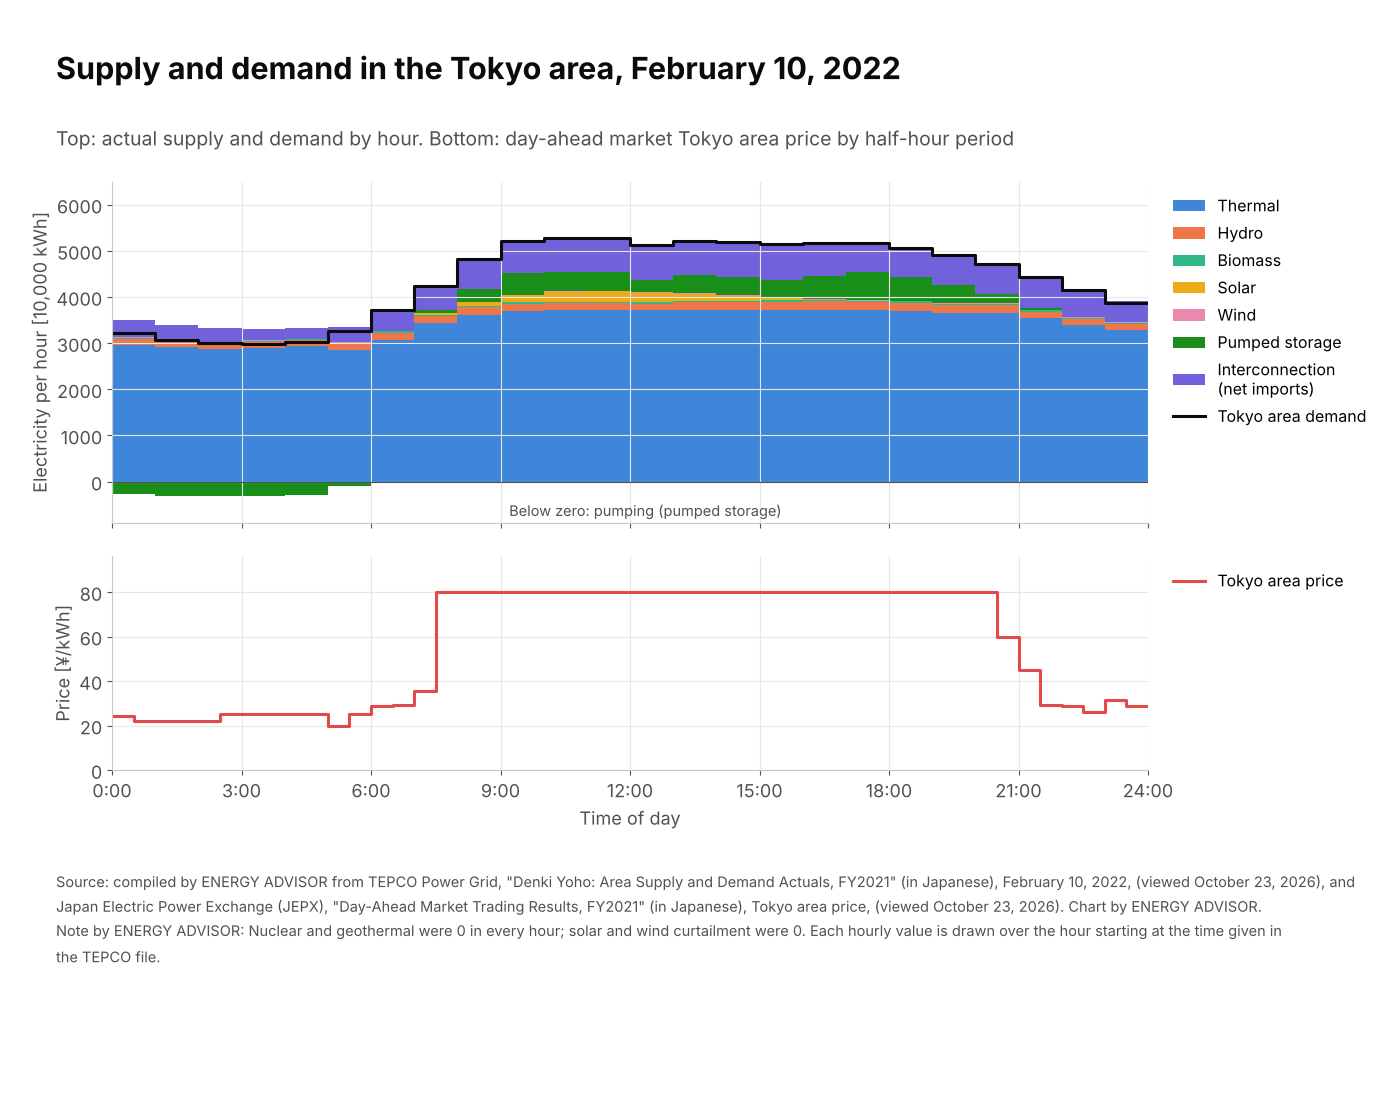
Figure 2 shows, as a past typical example, actual supply and demand in the Tokyo area on February 10, 2022. The Tokyo area is the area centered on the Greater Tokyo region, whose grid is operated by TEPCO Power Grid. It snowed in Tokyo that day, and solar generated little. The figure shows that supply and demand were kept in balance from morning to night by pumped-storage hydropower and by imports from other areas (electricity received through interconnection lines, the transmission facilities that link areas).
Spring and Autumn: Maintenance Outages and Shoulder-Season Risk (the Tight Supply-Demand Balance of March 2022)
Generators must be shut down for scheduled maintenance. Maintenance is done mainly in spring and autumn, when demand is lower. These periods are called shoulder seasons, and supply capacity tends to be lower in shoulder seasons.
The earthquake off Fukushima Prefecture on March 16, 2022 caused unplanned outages totaling 3,350 MW at thermal power plants and other facilities in the Tokyo and Tohoku areas. Compared with the day of the winter’s peak demand (January 6), power plants totaling 5,110 MW were on planned outages for repairs, maintenance and similar reasons. Unseasonable cold came on top of this, and alerts for a tight supply-demand balance were issued for the Tokyo area on March 21 and for the Tohoku area on March 22. The alerts were lifted for the Tohoku area at 23:00 on the 22nd and for the Tokyo area at 11:00 on the 23rd (ANRE, “Review of the Tight Electricity Supply-Demand Balance in Eastern Japan in March 2022,” p.3).
The status of generator outages can be checked in JEPX’s power plant outage information system (HJKS). HJKS is a system that discloses information on power plant outages and output reductions.
Why ¥0.01/kWh Periods Occur
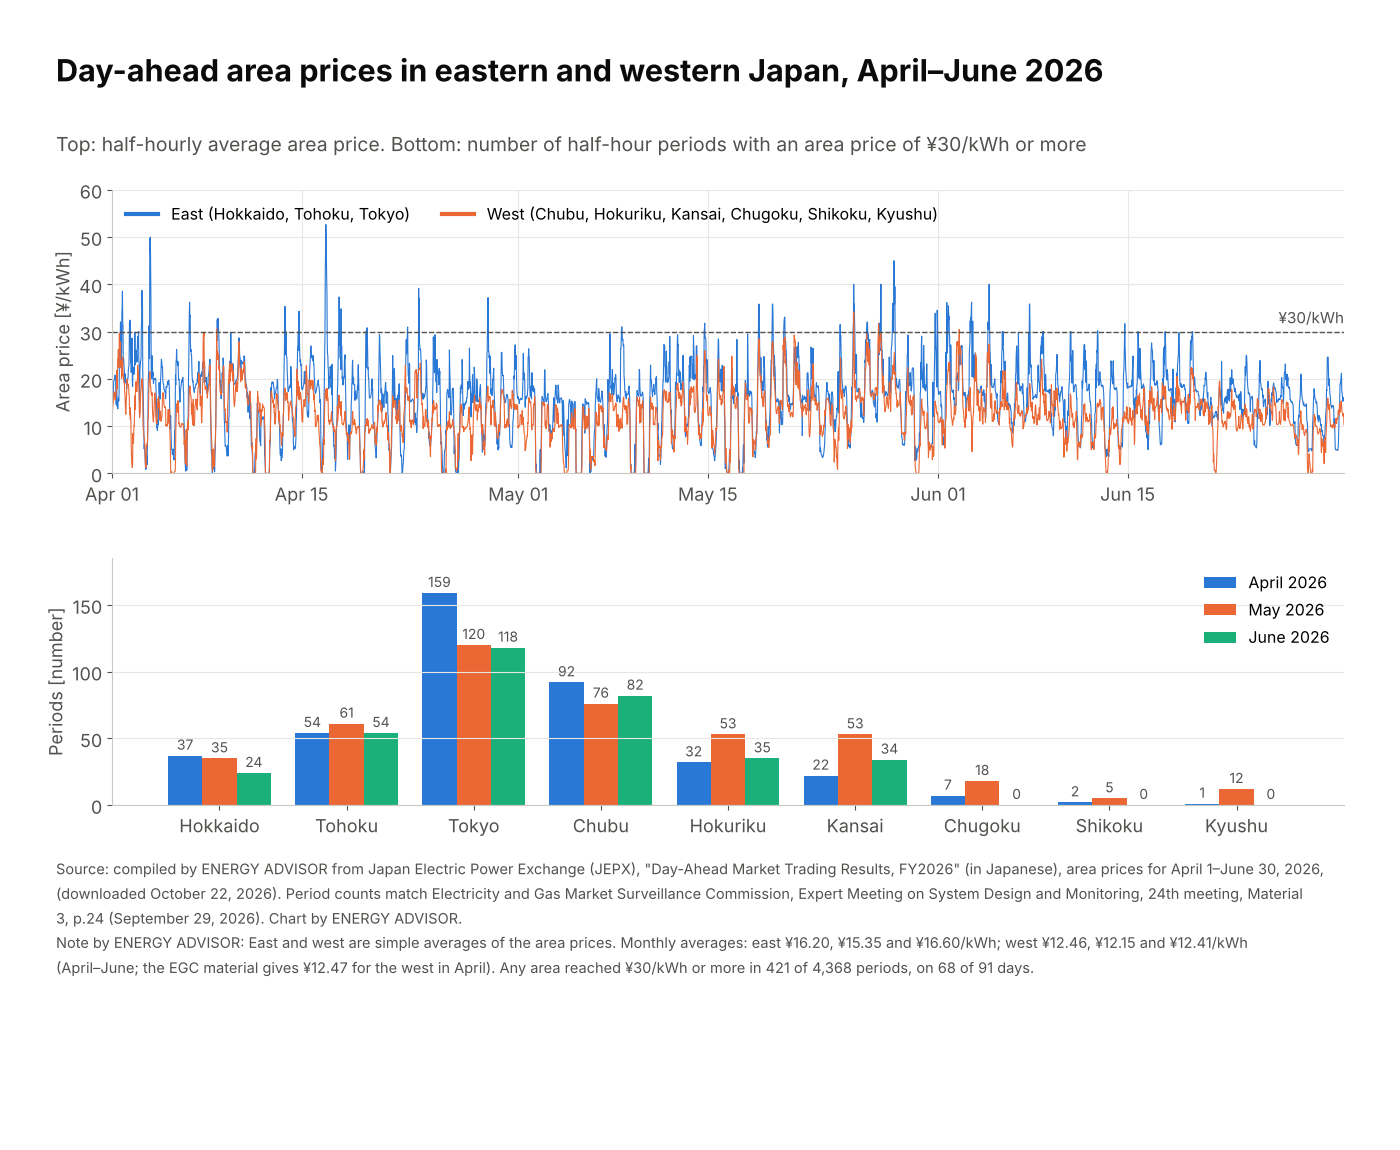
In hours when solar output is high and demand is low, sell bids at ¥0.01/kWh can exceed demand, and the clearing price can fall to ¥0.01/kWh. This is more likely in spring and autumn and during the daytime on holidays.
This pattern continues today. In April–June 2026, there were 241 periods on 23 days at ¥0.01/kWh. The highest price in the same quarter was ¥40.41/kWh in the 18:30–19:00 period on May 25, an evening period when solar output declines.
The FY2022 Price Spike and Fiscal-Year Averages Since Then
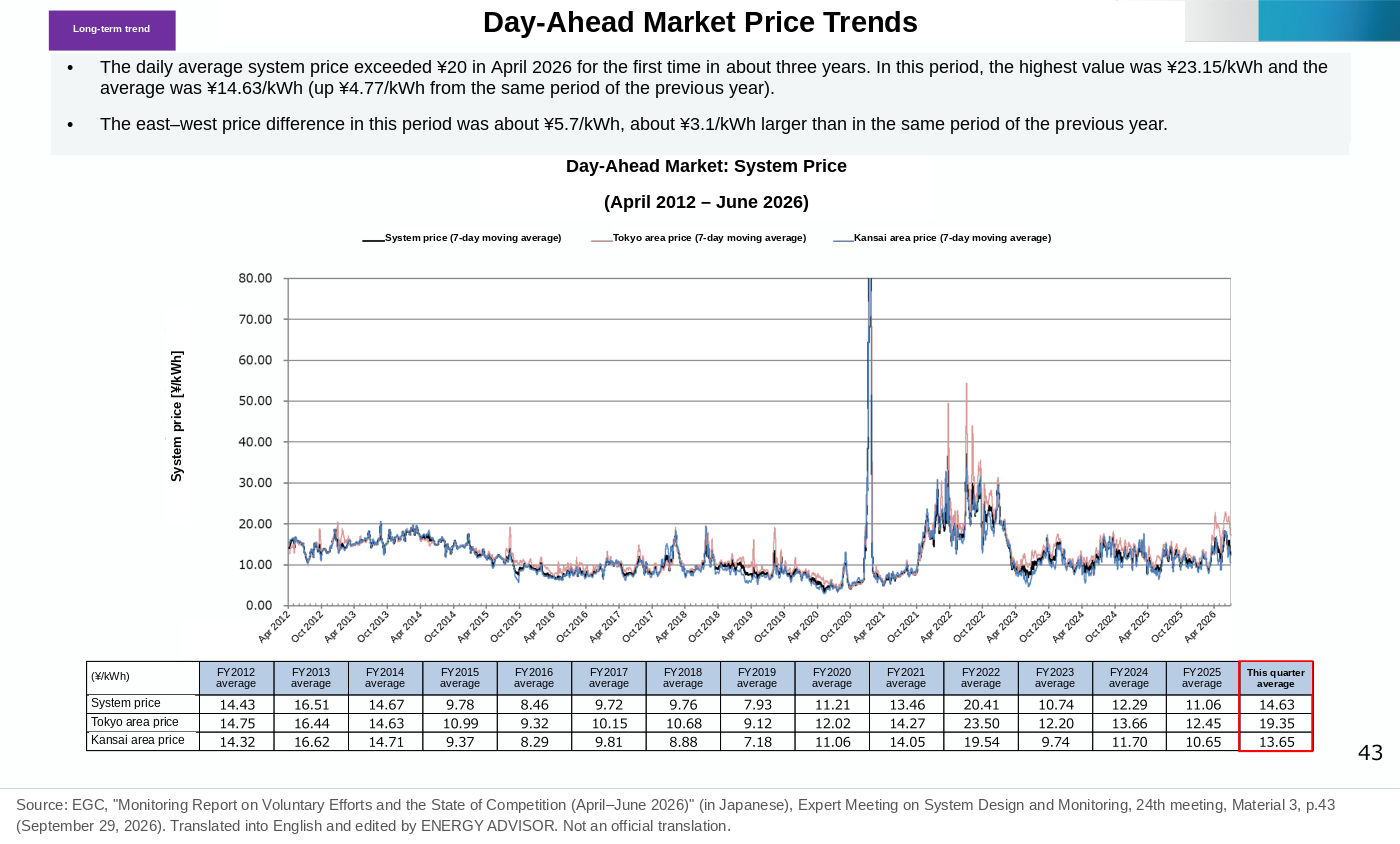
In August 2022, when the original post was written, prices were in the middle of a spike that had continued since late 2020. Since then, the fiscal-year average system price (the price for the nine areas combined) has moved as follows. Japan’s fiscal year runs from April to March; for example, FY2022 is April 2022–March 2023.
| Period | Average system price (¥/kWh) |
|---|---|
| FY2022 | 20.41 |
| FY2023 | 10.74 |
| FY2024 | 12.29 |
| FY2025 | 11.06 |
| April–June 2025 | 9.86 |
| April–June 2026 | 14.63 |
The fiscal-year average was highest in FY2022, and from FY2023 onward it has been in the ¥10–12/kWh range. In April–June 2026 it was ¥14.63/kWh, higher than in the same period a year earlier (¥9.86/kWh).

Summary
- Spot prices are set by the balance of demand and supply capacity
- Demand is high in summer and winter, so spot prices also tend to be high
- FIT solar purchased by GT&D companies is bid at ¥0.01/kWh, so spot prices fall in hours when solar output is high
- In summer, solar output also rises when demand is high, so prices rise mainly from evening into night. In winter, demand is high when the weather is bad, so prices tend to rise from morning to night
- In spring and autumn, maintenance outages reduce supply capacity, and the supply-demand balance can become tight, as in March 2022
OCCTO (the Organization for Cross-regional Coordination of Transmission Operators, JAPAN) and others publish outlooks of the cross-regional reserve margin (a ratio showing how much spare supply capacity there is relative to demand) for summer and winter. However, this is the reserve margin for one particular time of day. On bad-weather days in winter, the hours with high prices last from morning to night.
This article is based on published materials from the Ministry of Economy, Trade and Industry and its Agency for Natural Resources and Energy, the Electricity and Gas Market Surveillance Commission, the Organization for Cross-regional Coordination of Transmission Operators (OCCTO) and other sources. The English translations of figures are by ENERGY ADVISOR and are not official translations. When using this information for decisions, please check the original sources. When we find an error, we correct the article and note the date of the correction.
Sources
- Agency for Natural Resources and Energy, “Review of the Tight Electricity Supply-Demand Balance in Eastern Japan in March 2022” (Subcommittee on Electricity and Gas Basic Policy, 47th meeting, Material 3-4, April 12, 2022), p.3 (in Japanese). https://www.meti.go.jp/shingikai/enecho/denryoku_gas/denryoku_gas/pdf/047_03_04.pdf
- Electricity and Gas Market Surveillance Commission, Expert Meeting on System Design and Monitoring, 24th meeting, Material 3, “Monitoring Report on Voluntary Efforts and the State of Competition (April–June 2026),” pp.5, 12 and 43 (September 29, 2026) (in Japanese). https://www.egc.meti.go.jp/activity/emsc_systemsurveillance/pdf/024_03_00.pdf
- Japan Electric Power Exchange, day-ahead market trading results (in Japanese). https://www.jepx.jp/electricpower/market-data/spot/ . Trading results data for FY2022, FY2024, FY2025 and FY2026 (deliveries up to October 22) were used to confirm the fiscal-year average system prices (¥20.41, ¥12.29 and ¥11.06/kWh), the April–June averages for 2025 and 2026 (¥9.86 and ¥14.63/kWh), and the ¥0.01/kWh periods (241 periods on 23 days) and the highest price (¥40.41/kWh) in April–June 2026 (checked October 22, 2026).
- Agency for Natural Resources and Energy, “Making Renewables Japan’s Main Power Source: The FIP Scheme Starts in April 2022” (August 3, 2021) (in Japanese). https://www.enecho.meti.go.jp/about/special/johoteikyo/fip.html
- Japan Electric Power Exchange, power plant outage information system (HJKS) (in Japanese). https://hjks.jepx.or.jp/hjks/unit_status
- TEPCO Power Grid, area supply and demand data (source of the figures in the original post) (in Japanese). https://www.tepco.co.jp/forecast/html/area_data-j.html